---
title: "Data Science Methods for Forecasting in Energy and Economics"
date: 30 June 2025
author:
- name: Jonathan Berrisch
affiliations:
- ref: hemf
affiliations:
- id: hemf
name: University of Duisburg-Essen, House of Energy, Climate and Finance
format:
revealjs:
embed-resources: false
footer: ""
logo: assets/logos_combined.png
theme: [default, sydney.scss, custom.scss]
smaller: true
fig-format: svg
slide-number: true
execute:
daemon: false
highlight-style: github
---
## Outline
::: {.hidden}
$$
\newcommand{\A}{{\mathbb A}}
$$
:::
::: {style="font-size: 150%;"}
:::
[{{< fa bars-staggered >}}]{style="color: #404040;"} [Introduction & Research Motivation](#motivation)
[{{< fa bars-staggered >}}]{style="color: #404040;"} Overview of the Thesis
[{{< fa table >}}]{style="color: #404040;"} Online Learning
[{{< fa circle-nodes >}}]{style="color: #404040;"} Probabilistic Forecasting of European Carbon and Energy Prices
[{{< fa lightbulb >}}]{style="color: #404040;"} Limitations
[{{< fa binoculars >}}]{style="color: #404040;"} Contributions & Outlook
```{r, setup, include=FALSE}
# Compile with: rmarkdown::render("crps_learning.Rmd")
library(latex2exp)
library(ggplot2)
library(dplyr)
library(tidyr)
library(purrr)
library(kableExtra)
library(RefManageR)
knitr::opts_chunk$set(
dev = "svglite" # Use svg figures
)
BibOptions(
check.entries = TRUE,
bib.style = "authoryear",
cite.style = "authoryear",
style = "html",
hyperlink = TRUE,
dashed = FALSE
)
my_bib <- ReadBib("assets/library.bib", check = FALSE)
col_lightgray <- "#e7e7e7"
col_blue <- "#000088"
col_smooth_expost <- "#a7008b"
col_smooth <- "#187a00"
col_pointwise <- "#008790"
col_constant <- "#dd9002"
col_optimum <- "#666666"
```
# CRPS Learning
## Motivation
:::: {.columns}
::: {.column width="48%"}
The Idea:
- Combine multiple forecasts instead of choosing one
- Combination weights may vary over **time**, over the **distribution** or **both**
2 Popular options for combining distributions:
- Combining across quantiles (this paper)
- Horizontal aggregation, vincentization
- Combining across probabilities
- Vertical aggregation
:::
::: {.column width="2%"}
:::
::: {.column width="48%"}
::: {.panel-tabset}
## Time
```{r, echo = FALSE, fig.height=6, cache = TRUE}
par(mfrow = c(3, 3), mar = c(2, 2, 2, 2))
set.seed(1)
# Data
X <- matrix(ncol = 3, nrow = 15)
X[, 1] <- seq(from = 8, to = 12, length.out = 15) + 0.25 * rnorm(15)
X[, 2] <- 10 + 0.25 * rnorm(15)
X[, 3] <- seq(from = 12, to = 8, length.out = 15) + 0.25 * rnorm(15)
# Weights
w <- matrix(ncol = 3, nrow = 15)
w[, 1] <- sin(0.1 * 1:15)
w[, 2] <- cos(0.1 * 1:15)
w[, 3] <- seq(from = -2, 0.25, length.out = 15)^2
w <- (w / rowSums(w))
# Vis
plot(X[, 1],
lwd = 4,
type = "l",
ylim = c(8, 12),
xlab = "",
ylab = "",
xaxt = "n",
yaxt = "n",
bty = "n",
col = "#2050f0"
)
plot(w[, 1],
lwd = 4, type = "l",
ylim = c(0, 1),
xlab = "",
ylab = "", xaxt = "n", yaxt = "n", bty = "n", col = "#2050f0"
)
text(6, 0.5, TeX("$w_1(t)$"), cex = 2, col = "#2050f0")
arrows(13, 0.25, 15, 0.0, , lwd = 4, bty = "n")
plot.new()
plot(X[, 2],
lwd = 4,
type = "l", ylim = c(8, 12),
xlab = "", ylab = "", xaxt = "n", yaxt = "n", bty = "n", col = "purple"
)
plot(w[, 2],
lwd = 4, type = "l",
ylim = c(0, 1),
xlab = "",
ylab = "", xaxt = "n", yaxt = "n", bty = "n", col = "purple"
)
text(6, 0.6, TeX("$w_2(t)$"), cex = 2, col = "purple")
arrows(13, 0.5, 15, 0.5, , lwd = 4, bty = "n")
plot(rowSums(X * w), lwd = 4, type = "l", xlab = "", ylab = "", xaxt = "n", yaxt = "n", bty = "n", col = "#298829")
plot(X[, 3],
lwd = 4,
type = "l", ylim = c(8, 12),
xlab = "", ylab = "", xaxt = "n", yaxt = "n", bty = "n", col = "#e423b4"
)
plot(w[, 3],
lwd = 4, type = "l",
ylim = c(0, 1),
xlab = "",
ylab = "", xaxt = "n", yaxt = "n", bty = "n", col = "#e423b4"
)
text(6, 0.25, TeX("$w_3(t)$"), cex = 2, col = "#e423b4")
arrows(13, 0.75, 15, 1, , lwd = 4, bty = "n")
```
## Distribution
```{r, echo = FALSE, fig.height=6, cache = TRUE}
par(mfrow = c(3, 3), mar = c(2, 2, 2, 2))
set.seed(1)
# Data
X <- matrix(ncol = 3, nrow = 31)
X[, 1] <- dchisq(0:30, df = 10)
X[, 2] <- dnorm(0:30, mean = 15, sd = 5)
X[, 3] <- dexp(0:30, 0.2)
# Weights
w <- matrix(ncol = 3, nrow = 31)
w[, 1] <- sin(0.05 * 0:30)
w[, 2] <- cos(0.05 * 0:30)
w[, 3] <- seq(from = -2, 0.25, length.out = 31)^2
w <- (w / rowSums(w))
# Vis
plot(X[, 1],
lwd = 4,
type = "l",
xlab = "",
ylab = "",
xaxt = "n",
yaxt = "n",
bty = "n",
col = "#2050f0"
)
plot(X[, 2],
lwd = 4,
type = "l",
xlab = "", ylab = "", xaxt = "n", yaxt = "n", bty = "n", col = "purple"
)
plot(X[, 3],
lwd = 4,
type = "l",
xlab = "", ylab = "", xaxt = "n", yaxt = "n", bty = "n", col = "#e423b4"
)
plot(w[, 1],
lwd = 4, type = "l",
ylim = c(0, 1),
xlab = "",
ylab = "", xaxt = "n", yaxt = "n", bty = "n", col = "#2050f0"
)
text(12, 0.5, TeX("$w_1(x)$"), cex = 2, col = "#2050f0")
arrows(26, 0.25, 31, 0.0, , lwd = 4, bty = "n")
plot(w[, 2],
lwd = 4, type = "l",
ylim = c(0, 1),
xlab = "",
ylab = "", xaxt = "n", yaxt = "n", bty = "n", col = "purple"
)
text(15, 0.5, TeX("$w_2(x)$"), cex = 2, col = "purple")
arrows(15, 0.25, 15, 0, , lwd = 4, bty = "n")
plot(w[, 3],
lwd = 4, type = "l",
ylim = c(0, 1),
xlab = "",
ylab = "", xaxt = "n", yaxt = "n", bty = "n", col = "#e423b4"
)
text(20, 0.5, TeX("$w_3(x)$"), cex = 2, col = "#e423b4")
arrows(5, 0.25, 0, 0, , lwd = 4, bty = "n")
plot.new()
plot(rowSums(X * w),
lwd = 4, type = "l", xlab = "", ylab = "", xaxt = "n",
yaxt = "n", bty = "n", col = "#298829"
)
```
:::
:::
::::
## The Framework of Prediction under Expert Advice
### The sequential framework
:::: {.columns}
::: {.column width="48%"}
Each day, $t = 1, 2, ... T$
- The **forecaster** receives predictions $\widehat{X}_{t,k}$ from $K$ **experts**
- The **forecaster** assings weights $w_{t,k}$ to each **expert**
- The **forecaster** calculates her prediction:
\begin{equation}
\widetilde{X}_{t} = \sum_{k=1}^K w_{t,k} \widehat{X}_{t,k}.
\label{eq_forecast_def}
\end{equation}
- The realization for $t$ is observedilities
- Vertical aggregation
:::
::: {.column width="2%"}
:::
::: {.column width="48%"}
- The experts can be institutions, persons, or models
- The forecasts can be point-forecasts (i.e., mean or median) or full predictive distributions
- We do not need any assumptions concerning the underlying data
- `r Citet(my_bib, "cesa2006prediction")`
:::
::::
---
## The Regret
Weights are updated sequentially according to the past performance of the $K$ experts.
That is, a loss function $\ell$ is needed. This is used to compute the **cumulative regret** $R_{t,k}$
$$
R_{t,k} = \widetilde{L}_{t} - \widehat{L}_{t,k} = \sum_{i = 1}^t \ell(\widetilde{X}_{i},Y_i) - \ell(\widehat{X}_{i,k},Y_i)
$${#eq-regret}
The cumulative regret:
- Indicates the predictive accuracy of the expert $k$ until time $t$.
- Measures how much the forecaster *regrets* not having followed the expert's advice
Popular loss functions for point forecasting `r Citet(my_bib, "gneiting2011making")`:
:::: {.columns}
::: {.column width="48%"}
$\ell_2$ loss:
$$\ell_2(x, y) = | x -y|^2$${#eq-elltwo}
Strictly proper for *mean* prediction
:::
::: {.column width="2%"}
:::
::: {.column width="48%"}
$\ell_1$ loss:
$$\ell_1(x, y) = | x -y|$${#eq-ellone}
Strictly proper for *median* predictions
:::
::::
## Popular Aggregation Algorithms
#### The naive combination
$$
w_{t,k}^{\text{Naive}} = \frac{1}{K}
$${#eq-wtk_naive}
#### The exponentially weighted average forecaster (EWA)
\begin{align}
w_{t,k}^{\text{EWA}} & = \frac{e^{\eta R_{t,k}} }{\sum_{k = 1}^K e^{\eta R_{t,k}}}
=
\frac{e^{-\eta \ell(\widehat{X}_{t,k},Y_t)} w^{\text{EWA}}_{t-1,k} }{\sum_{k = 1}^K e^{-\eta \ell(\widehat{X}_{t,k},Y_t)} w^{\text{EWA}}_{t-1,k} }
\label{eq_ewa_general}
\end{align}
#### The polynomial weighted aggregation (PWA)
\begin{align}
w_{t,k}^{\text{PWA}} & = \frac{ 2(R_{t,k})^{q-1}_{+} }{ \|(R_t)_{+}\|^{q-2}_q}
\label{eq_pwa_general}
\end{align}
with $q\geq 2$ and $x_{+}$ the (vector) of positive parts of $x$.
## Optimality
In stochastic settings, the cumulative Risk should be analyezed `r Citet(my_bib, "wintenberger2017optimal")`:
\begin{align}
\underbrace{\widetilde{\mathcal{R}}_t = \sum_{i=1}^t \mathbb{E}[\ell(\widetilde{X}_{i},Y_i)|\mathcal{F}_{i-1}]}_{\text{Cumulative Risk of Forecaster}} \qquad\qquad\qquad \text{ and } \qquad\qquad\qquad
\underbrace{\widehat{\mathcal{R}}_{t,k} = \sum_{i=1}^t \mathbb{E}[\ell(\widehat{X}_{i,k},Y_i)|\mathcal{F}_{i-1}]}_{\text{Cumulative Risk of Experts}}
\label{eq_def_cumrisk}
\end{align}
There are two problems that an algorithm should solve in iid settings:
:::: {.columns}
::: {.column width="48%"}
### The selection problem
\begin{equation}
\frac{1}{t}\left(\widetilde{\mathcal{R}}_t - \widehat{\mathcal{R}}_{t,\min} \right) \stackrel{t\to \infty}{\rightarrow} a \quad \text{with} \quad a \leq 0.
\label{eq_opt_select}
\end{equation}
The forecaster is asymptotically not worse than the best expert $\widehat{\mathcal{R}}_{t,\min}$.
:::
::: {.column width="2%"}
:::
::: {.column width="48%"}
### The convex aggregation problem
\begin{equation}
\frac{1}{t}\left(\widetilde{\mathcal{R}}_t - \widehat{\mathcal{R}}_{t,\pi} \right) \stackrel{t\to \infty}{\rightarrow} b \quad \text{with} \quad b \leq 0 .
\label{eq_opt_conv}
\end{equation}
The forecaster is asymptotically not worse than the best convex combination $\widehat{X}_{t,\pi}$ in hindsight (**oracle**).
:::
::::
## Optimality
Satisfying the convexity property \eqref{eq_opt_conv} comes at the cost of slower possible convergence.
According to `r Citet(my_bib, "wintenberger2017optimal")`, an algorithm has optimal rates with respect to selection \eqref{eq_opt_select} and convex aggregation \eqref{eq_opt_conv} if
\begin{align}
\frac{1}{t}\left(\widetilde{\mathcal{R}}_t - \widehat{\mathcal{R}}_{t,\min} \right) & =
\mathcal{O}\left(\frac{\log(K)}{t}\right)\label{eq_optp_select}
\end{align}
\begin{align}
\frac{1}{t}\left(\widetilde{\mathcal{R}}_t - \widehat{\mathcal{R}}_{t,\pi} \right) & =
\mathcal{O}\left(\sqrt{\frac{\log(K)}{t}}\right)
\label{eq_optp_conv}
\end{align}
Algorithms can statisfy both \eqref{eq_optp_select} and \eqref{eq_optp_conv} depending on:
- The loss function
- Regularity conditions on $Y_t$ and $\widehat{X}_{t,k}$
- The weighting scheme
## Optimality
According to `r Citet(my_bib, "cesa2006prediction")` EWA \eqref{eq_ewa_general} satisfies the optimal selection convergence \eqref{eq_optp_select} in a deterministic setting if the:
- Loss $\ell$ is exp-concave
- Learning-rate $\eta$ is chosen correctly
Those results can be converted to stochastic iid settings `r Citet(my_bib, "kakade2008generalization")` `r Citet(my_bib, "gaillard2014second")`.
The optimal convex aggregation convergence \eqref{eq_optp_conv} can be satisfied by applying the kernel-trick. Thereby, the loss is linearized:
\begin{align}
\ell^{\nabla}(x,y) = \ell'(\widetilde{X},y) x
\end{align}
$\ell'$ is the subgradient of $\ell$ in its first coordinate evaluated at forecast combination $\widetilde{X}$.
Combining probabilistic forecasts calls for a probabilistic loss function
:::: {.notes}
We apply Bernstein Online Aggregation (BOA). It lets us weaken the exp-concavity condition while almost keeping the optimalities \ref{eq_optp_select} and \ref{eq_optp_conv}.
::::
## The Continuous Ranked Probability Score
:::: {.columns}
::: {.column width="48%"}
**An appropriate choice:**
\begin{align*}
\text{CRPS}(F, y) & = \int_{\mathbb{R}} {(F(x) - \mathbb{1}\{ x > y \})}^2 dx
\label{eq_crps}
\end{align*}
It's strictly proper `r Citet(my_bib, "gneiting2007strictly")`.
Using the CRPS, we can calculate time-adaptive weight $w_{t,k}$. However, what if the experts' performance is not uniform over all parts of the distribution?
The idea: utilize this relation:
\begin{align*}
\text{CRPS}(F, y) = 2 \int_0^{1} \text{QL}_p(F^{-1}(p), y) \, d p.
\label{eq_crps_qs}
\end{align*}
:::
::: {.column width="2%"}
:::
::: {.column width="48%"}
to combine quantiles of the probabilistic forecasts individually using the quantile-loss (QL):
\begin{align*}
\text{QL}_p(q, y) & = (\mathbb{1}\{y < q\} -p)(q - y)
\end{align*}
**But is it optimal?**
CRPS is exp-concave `r fontawesome::fa("check", fill ="#00b02f")`
`r fontawesome::fa("arrow-right", fill ="#000000")` EWA \eqref{eq_ewa_general} with CRPS satisfies \eqref{eq_optp_select} and \eqref{eq_optp_conv}
QL is convex, but not exp-concave `r fontawesome::fa("exclamation", fill ="#ffa600")`
`r fontawesome::fa("arrow-right", fill ="#000000")` Bernstein Online Aggregation (BOA) lets us weaken the exp-concavity condition while almost keeping optimal convergence
:::
::::
## CRPS-Learning Optimality
For convex losses, BOAG satisfies that there exist a $C>0$ such that for $x>0$ it holds that
\begin{equation}
P\left( \frac{1}{t}\left(\widetilde{\mathcal{R}}_t - \widehat{\mathcal{R}}_{t,\pi} \right) \leq C \log(\log(t)) \left(\sqrt{\frac{\log(K)}{t}} + \frac{\log(K)+x}{t}\right) \right) \geq
1-e^{x}
\label{eq_boa_opt_conv}
\end{equation}
`r fontawesome::fa("arrow-right", fill ="#000000")` Almost optimal w.r.t *convex aggregation* \eqref{eq_optp_conv} `r Citet(my_bib, "wintenberger2017optimal")` .
The same algorithm satisfies that there exist a $C>0$ such that for $x>0$ it holds that
\begin{equation}
P\left( \frac{1}{t}\left(\widetilde{\mathcal{R}}_t - \widehat{\mathcal{R}}_{t,\min} \right) \leq
C\left(\frac{\log(K)+\log(\log(Gt))+ x}{\alpha t}\right)^{\frac{1}{2-\beta}} \right) \geq
1-e^{x}
\label{eq_boa_opt_select}
\end{equation}
if $Y_t$ is bounded, the considered loss $\ell$ is convex $G$-Lipschitz and weak exp-concave in its first coordinate.
This is for losses that satisfy **A1** and **A2**.
## CRPS-Learning Optimality
:::: {.columns}
::: {.column width="48%"}
**A1**
For some $G>0$ it holds
for all $x_1,x_2\in \mathbb{R}$ and $t>0$ that
$$ | \ell(x_1, Y_t)-\ell(x_2, Y_t) | \leq G |x_1-x_2|$$
**A2** For some $\alpha>0$, $\beta\in[0,1]$ it holds
for all $x_1,x_2 \in \mathbb{R}$ and $t>0$ that
\begin{align*}
\mathbb{E}[
& \ell(x_1, Y_t)-\ell(x_2, Y_t) | \mathcal{F}_{t-1}] \leq \\
& \mathbb{E}[ \ell'(x_1, Y_t)(x_1 - x_2) |\mathcal{F}_{t-1}] \\
& +
\mathbb{E}\left[ \left. \left( \alpha(\ell'(x_1, Y_t)(x_1 - x_2))^{2}\right)^{1/\beta} \right|\mathcal{F}_{t-1}\right]
\end{align*}
`r fontawesome::fa("arrow-right", fill ="#000000")` Almost optimal w.r.t *selection* \eqref{eq_optp_select} `r Citet(my_bib, "gaillard2018efficient")`.
:::
::: {.column width="2%"}
:::
::: {.column width="48%"}
**Lemma 1**
\begin{align}
2\overline{\widehat{\mathcal{R}}}^{\text{QL}}_{t,\min}
& \leq \widehat{\mathcal{R}}^{\text{CRPS}}_{t,\min}
\label{eq_risk_ql_crps_expert} \\
2\overline{\widehat{\mathcal{R}}}^{\text{QL}}_{t,\pi}
& \leq \widehat{\mathcal{R}}^{\text{CRPS}}_{t,\pi} .
\label{eq_risk_ql_crps_convex}
\end{align}
Pointwise can outperform constant procedures
QL is convex but not exp-concave:
`r fontawesome::fa("arrow-right")` Almost optimal convergence w.r.t. *convex aggregation* \eqref{eq_boa_opt_conv} `r fontawesome::fa("check", fill ="#00b02f")`
For almost optimal congerence w.r.t. *selection* \eqref{eq_boa_opt_select} we need to check **A1** and **A2**:
QL is Lipschitz continuous:
`r fontawesome::fa("arrow-right")` **A1** holds `r fontawesome::fa("check", fill ="#ffa600")`
:::
::::
## CRPS-Learning Optimality
:::: {.columns}
::: {.column width="48%"}
Conditional quantile risk: $\mathcal{Q}_p(x) = \mathbb{E}[ \text{QL}_p(x, Y_t) | \mathcal{F}_{t-1}]$.
`r fontawesome::fa("arrow-right")` convexity properties of $\mathcal{Q}_p$ depend on the
conditional distribution $Y_t|\mathcal{F}_{t-1}$.
**Proposition 1**
Let $Y$ be a univariate random variable with (Radon-Nikodym) $\nu$-density $f$, then for the second subderivative of the quantile risk
$\mathcal{Q}_p(x) = \mathbb{E}[ \text{QL}_p(x, Y) ]$
of $Y$ it holds for all $p\in(0,1)$ that
$\mathcal{Q}_p'' = f.$
Additionally, if $f$ is a continuous Lebesgue-density with $f\geq\gamma>0$ for some constant $\gamma>0$ on its support $\text{spt}(f)$ then
is $\mathcal{Q}_p$ is $\gamma$-strongly convex.
Strong convexity with $\beta=1$ implies **A2** `r fontawesome::fa("check", fill ="#ffa600")` `r Citet(my_bib, "gaillard2018efficient")`
:::
::: {.column width="2%"}
:::
::: {.column width="48%"}
`r fontawesome::fa("arrow-right")` **A1** and **A2** give us almost optimal convergence w.r.t. selection \eqref{eq_boa_opt_select} `r fontawesome::fa("check", fill ="#00b02f")`
**Theorem 1**
The gradient based fully adaptive Bernstein online aggregation (BOAG) applied pointwise for all $p\in(0,1)$ on $\text{QL}$ satisfies
\eqref{eq_boa_opt_conv} with minimal CRPS given by
$$\widehat{\mathcal{R}}_{t,\pi} = 2\overline{\widehat{\mathcal{R}}}^{\text{QL}}_{t,\pi}.$$
If $Y_t|\mathcal{F}_{t-1}$ is bounded
and has a pdf $f_t$ satifying $f_t>\gamma >0$ on its
support $\text{spt}(f_t)$ then \ref{eq_boa_opt_select} holds with $\beta=1$ and
$$\widehat{\mathcal{R}}_{t,\min} = 2\overline{\widehat{\mathcal{R}}}^{\text{QL}}_{t,\min}$$.
:::
::::
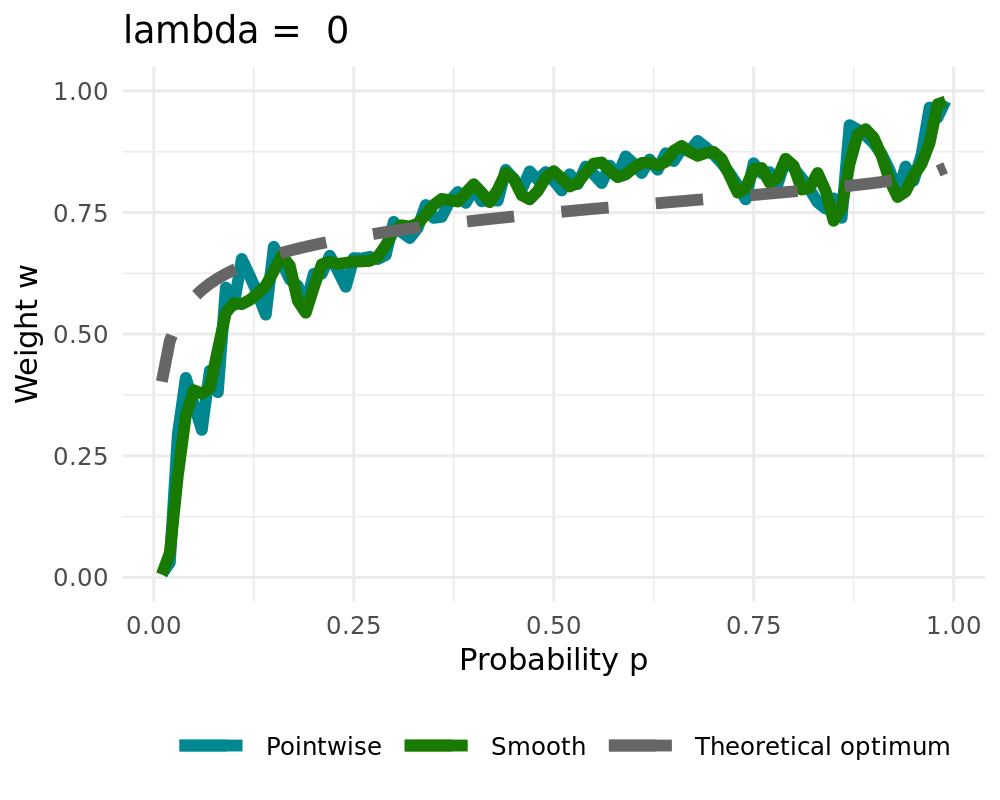
## A Probabilistic Example
:::: {.columns}
::: {.column width="48%"}
Simple Example:
\begin{align}
Y_t & \sim \mathcal{N}(0,\,1) \\
\widehat{X}_{t,1} & \sim \widehat{F}_{1} = \mathcal{N}(-1,\,1) \\
\widehat{X}_{t,2} & \sim \widehat{F}_{2} = \mathcal{N}(3,\,4)
\label{eq:dgp_sim1}
\end{align}
- True weights vary over $p$
- Figures show the ECDF and calculated weights using $T=25$ realizations
- Pointwise solution creates rough estimates
- Pointwise is better than constant
- Smooth solution is better than pointwise
:::
::: {.column width="2%"}
:::
::: {.column width="48%"}
::: {.panel-tabset}
## CDFs
```{r, echo = FALSE, fig.width=7, fig.height=6, fig.align='center', cache = TRUE}
source("assets/01_common.R")
load("assets/crps_learning/01_motivation_01.RData")
ggplot(df, aes(x = x, y = y, xend = xend, yend = yend)) +
stat_function(
fun = pnorm, n = 10000,
args = list(mean = dev[2], sd = experts_sd[2]),
aes(col = "Expert 2"), size = 1.5
) +
stat_function(
fun = pnorm, n = 10000,
args = list(mean = dev[1], sd = experts_sd[1]),
aes(col = "Expert 1"), size = 1.5
) +
stat_function(
fun = pnorm,
n = 10000,
size = 1.5, aes(col = "DGP") # , linetype = "dashed"
) +
geom_point(aes(col = "ECDF"), size = 1.5, show.legend = FALSE) +
geom_segment(aes(col = "ECDF")) +
geom_segment(data = tibble(
x_ = -5,
xend_ = min(y),
y_ = 0,
yend_ = 0
), aes(x = x_, xend = xend_, y = y_, yend = yend_)) +
theme_minimal() +
theme(
text = element_text(size = text_size),
legend.position = "bottom",
legend.key.width = unit(1.5, "cm")
) +
ylab("Probability p") +
xlab("Value") +
scale_colour_manual(NULL, values = c("#969696", "#252525", col_auto, col_blue)) +
guides(color = guide_legend(
nrow = 2,
byrow = FALSE # ,
# override.aes = list(
# size = c(1.5, 1.5, 1.5, 1.5)
# )
)) +
scale_x_continuous(limits = c(-5, 7.5))
```
## Weights
```{r, echo = FALSE, fig.width=7, fig.height=6, fig.align='center', cache = TRUE}
source("assets/01_common.R")
load("assets/crps_learning/01_motivation_02.RData")
ggplot() +
geom_line(data = weights[weights$var != "1Optimum", ], size = 1.5, aes(x = prob, y = val, col = var)) +
geom_line(
data = weights[weights$var == "1Optimum", ], size = 1.5, aes(x = prob, y = val, col = var) # , linetype = "dashed"
) +
theme_minimal() +
theme(
text = element_text(size = text_size),
legend.position = "bottom",
legend.key.width = unit(1.5, "cm")
) +
xlab("Probability p") +
ylab("Weight w") +
scale_colour_manual(
NULL,
values = c("#969696", col_pointwise, col_p_constant, col_p_smooth),
labels = modnames[-c(3, 5)]
) +
guides(color = guide_legend(
ncol = 3,
byrow = FALSE,
title.hjust = 5,
# override.aes = list(
# linetype = c(rep("solid", 5), "dashed")
# )
)) +
ylim(c(0, 1))
```
::::
:::
:::
## The Smoothing Procedure
:::: {.columns}
::: {.column width="48%"}
We are using penalized cubic b-splines:
Let $\varphi=(\varphi_1,\ldots, \varphi_L)$ be bounded basis functions on $(0,1)$ Then we approximate $w_{t,k}$ by
\begin{align}
w_{t,k}^{\text{smooth}} = \sum_{l=1}^L \beta_l \varphi_l = \beta'\varphi
\end{align}
with parameter vector $\beta$. The latter is estimated penalized $L_2$-smoothing which minimizes
\begin{equation}
\| w_{t,k} - \beta' \varphi \|^2_2 + \lambda \| \mathcal{D}^{d} (\beta' \varphi) \|^2_2
\label{eq_function_smooth}
\end{equation}
with differential operator $\mathcal{D}$
Smoothing can be applied ex-post or inside of the algorithm ( `r fontawesome::fa("arrow-right", fill ="#000000")` [Simulation](#simulation)).
:::
::: {.column width="2%"}
:::
::: {.column width="48%"}
We receive the constant solution for high values of $\lambda$ when setting $d=1$
 :::
::::
---
## The Proposed CRPS-Learning Algorithm
```{r, fig.align="left", echo=FALSE, out.width = "1000px", cache = TRUE}
knitr::include_graphics("assets/crps_learning/algorithm_1.svg")
```
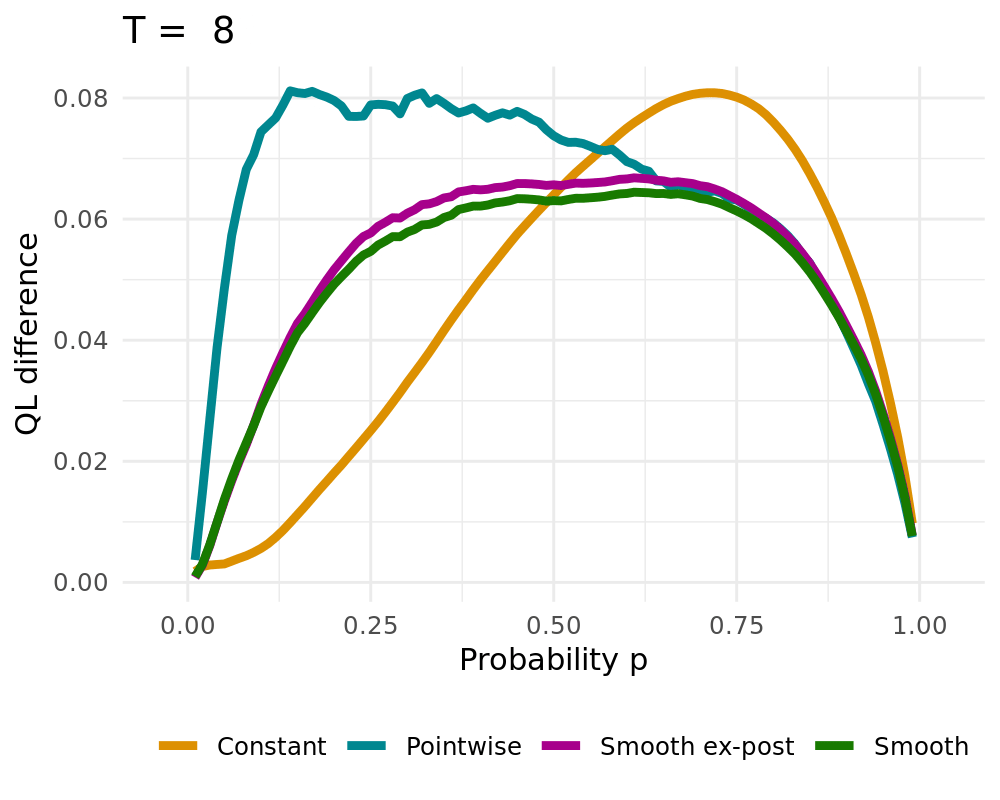
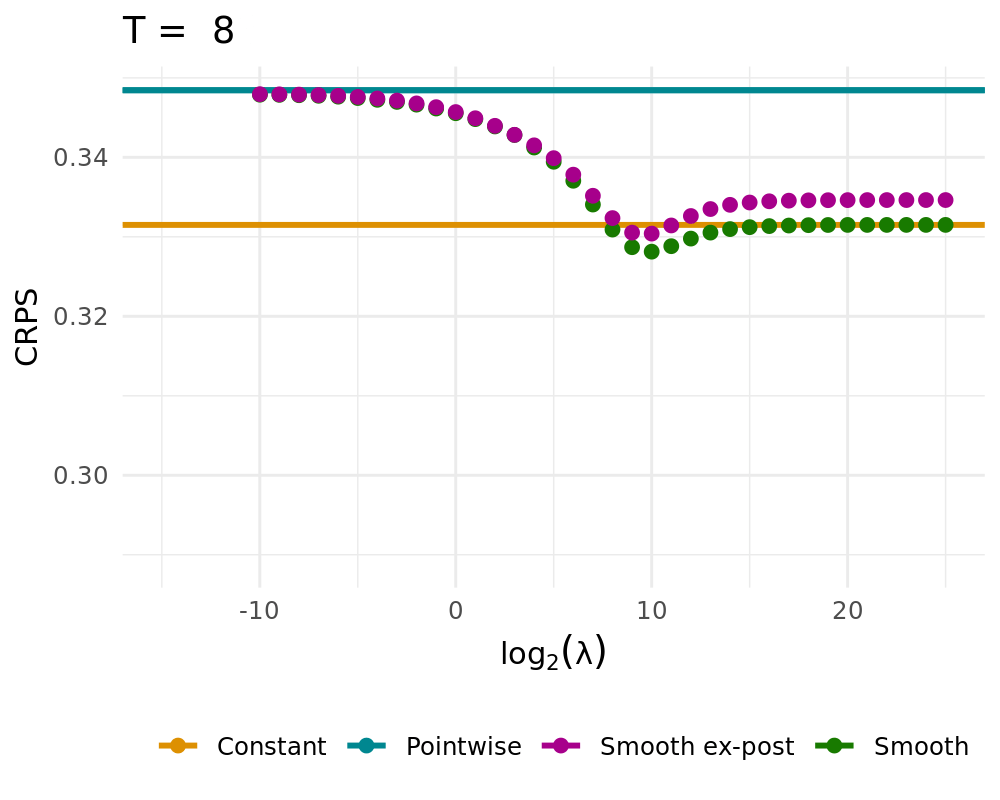
## Simulation Study
:::: {.columns}
::: {.column width="48%"}
Data Generating Process of the [simple probabilistic example](#simple_example)
- Constant solution $\lambda \rightarrow \infty$
- Pointwise Solution of the proposed BOAG
- Smoothed Solution of the proposed BOAG
- Weights are smoothed during learning
- Smooth weights are used to calculate Regret, adjust weights, etc.
- Smooth ex-post solution
- Weights are smoothed after the learning
- Algorithm always uses non-smoothed weights
:::
::: {.column width="2%"}
:::
::: {.column width="48%"}
::: {.panel-tabset}
## QL Deviation
## CRPS vs. Lambda
CRPS Values for different $\lambda$ (1000 runs)
::::
:::
::::
## Simulation Study
The same simulation carried out for different algorithms (1000 runs):
:::
::::
---
## The Proposed CRPS-Learning Algorithm
```{r, fig.align="left", echo=FALSE, out.width = "1000px", cache = TRUE}
knitr::include_graphics("assets/crps_learning/algorithm_1.svg")
```
## Simulation Study
:::: {.columns}
::: {.column width="48%"}
Data Generating Process of the [simple probabilistic example](#simple_example)
- Constant solution $\lambda \rightarrow \infty$
- Pointwise Solution of the proposed BOAG
- Smoothed Solution of the proposed BOAG
- Weights are smoothed during learning
- Smooth weights are used to calculate Regret, adjust weights, etc.
- Smooth ex-post solution
- Weights are smoothed after the learning
- Algorithm always uses non-smoothed weights
:::
::: {.column width="2%"}
:::
::: {.column width="48%"}
::: {.panel-tabset}
## QL Deviation

## CRPS vs. Lambda
CRPS Values for different $\lambda$ (1000 runs)

::::
:::
::::
## Simulation Study
The same simulation carried out for different algorithms (1000 runs):
 ## Simulation Study
:::: {.columns}
::: {.column width="48%"}
**New DGP:**
\begin{align}
Y_t & \sim \mathcal{N}\left(\frac{\sin(0.005 \pi t )}{2},\,1\right) \\
\widehat{X}_{t,1} & \sim \widehat{F}_{1} = \mathcal{N}(-1,\,1) \\
\widehat{X}_{t,2} & \sim \widehat{F}_{2} = \mathcal{N}(3,\,4) \label{eq_dgp_sim2}
\end{align}
`r fontawesome::fa("arrow-right", fill ="#000000")` Changing optimal weights
`r fontawesome::fa("arrow-right", fill ="#000000")` Single run example depicted aside
`r fontawesome::fa("arrow-right", fill ="#000000")` No forgetting leads to long-term constant weights
:::
::: {.column width="2%"}
:::
::: {.column width="48%"}
**Weights of expert 2**
```{r, echo = FALSE, fig.width=7, fig.height=5, fig.align='center', cache = TRUE}
load("assets/crps_learning/changing_weights.rds")
mod_labs <- c("Optimum", "Pointwise", "Smooth", "Constant")
names(mod_labs) <- c("TOptimum", "Pointwise", "Smooth", "Constant")
colseq <- c(grey(.99), "orange", "red", "purple", "blue", "darkblue", "black")
weights_preprocessed %>%
mutate(w = 1 - w) %>%
ggplot(aes(t, p, fill = w)) +
geom_raster(interpolate = TRUE) +
facet_grid(Mod ~ ., labeller = labeller(Mod = mod_labs)) +
theme_minimal() +
theme(
# plot.margin = unit(c(0.5, 0.5, 0.5, 0.5), "cm"),
text = element_text(size = 15),
legend.key.height = unit(1, "inch")
) +
scale_x_continuous(expand = c(0, 0)) +
xlab("Time t") +
scale_fill_gradientn(
limits = c(0, 1),
colours = colseq,
breaks = seq(0, 1, 0.2)
) +
ylab("Weight w")
```
:::
::::
## Simulation Results
The simulation using the new DGP carried out for different algorithms (1000 runs):
## Simulation Study
:::: {.columns}
::: {.column width="48%"}
**New DGP:**
\begin{align}
Y_t & \sim \mathcal{N}\left(\frac{\sin(0.005 \pi t )}{2},\,1\right) \\
\widehat{X}_{t,1} & \sim \widehat{F}_{1} = \mathcal{N}(-1,\,1) \\
\widehat{X}_{t,2} & \sim \widehat{F}_{2} = \mathcal{N}(3,\,4) \label{eq_dgp_sim2}
\end{align}
`r fontawesome::fa("arrow-right", fill ="#000000")` Changing optimal weights
`r fontawesome::fa("arrow-right", fill ="#000000")` Single run example depicted aside
`r fontawesome::fa("arrow-right", fill ="#000000")` No forgetting leads to long-term constant weights
:::
::: {.column width="2%"}
:::
::: {.column width="48%"}
**Weights of expert 2**
```{r, echo = FALSE, fig.width=7, fig.height=5, fig.align='center', cache = TRUE}
load("assets/crps_learning/changing_weights.rds")
mod_labs <- c("Optimum", "Pointwise", "Smooth", "Constant")
names(mod_labs) <- c("TOptimum", "Pointwise", "Smooth", "Constant")
colseq <- c(grey(.99), "orange", "red", "purple", "blue", "darkblue", "black")
weights_preprocessed %>%
mutate(w = 1 - w) %>%
ggplot(aes(t, p, fill = w)) +
geom_raster(interpolate = TRUE) +
facet_grid(Mod ~ ., labeller = labeller(Mod = mod_labs)) +
theme_minimal() +
theme(
# plot.margin = unit(c(0.5, 0.5, 0.5, 0.5), "cm"),
text = element_text(size = 15),
legend.key.height = unit(1, "inch")
) +
scale_x_continuous(expand = c(0, 0)) +
xlab("Time t") +
scale_fill_gradientn(
limits = c(0, 1),
colours = colseq,
breaks = seq(0, 1, 0.2)
) +
ylab("Weight w")
```
:::
::::
## Simulation Results
The simulation using the new DGP carried out for different algorithms (1000 runs):
 ## Possible Extensions
:::: {.columns}
::: {.column width="48%"}
**Forgetting**
- Only taking part of the old cumulative regret into account
- Exponential forgetting of past regret
\begin{align*}
R_{t,k} & = R_{t-1,k}(1-\xi) + \ell(\widetilde{F}_{t},Y_i) - \ell(\widehat{F}_{t,k},Y_i) \label{eq_regret_forget}
\end{align*}
**Fixed Shares** `r Citet(my_bib, "herbster1998tracking")`
- Adding fixed shares to the weights
- Shrinkage towards a constant solution
\begin{align*}
\widetilde{w}_{t,k} = \rho \frac{1}{K} + (1-\rho) w_{t,k}
\label{fixed_share_simple}.
\end{align*}
:::
::: {.column width="2%"}
:::
::: {.column width="48%"}
**Non-Equidistant Knots**
- Non-equidistant spline-basis could be used
- Potentially improves the tail-behavior
- Destroys shrinkage towards constant
## Possible Extensions
:::: {.columns}
::: {.column width="48%"}
**Forgetting**
- Only taking part of the old cumulative regret into account
- Exponential forgetting of past regret
\begin{align*}
R_{t,k} & = R_{t-1,k}(1-\xi) + \ell(\widetilde{F}_{t},Y_i) - \ell(\widehat{F}_{t,k},Y_i) \label{eq_regret_forget}
\end{align*}
**Fixed Shares** `r Citet(my_bib, "herbster1998tracking")`
- Adding fixed shares to the weights
- Shrinkage towards a constant solution
\begin{align*}
\widetilde{w}_{t,k} = \rho \frac{1}{K} + (1-\rho) w_{t,k}
\label{fixed_share_simple}.
\end{align*}
:::
::: {.column width="2%"}
:::
::: {.column width="48%"}
**Non-Equidistant Knots**
- Non-equidistant spline-basis could be used
- Potentially improves the tail-behavior
- Destroys shrinkage towards constant
 :::
::::
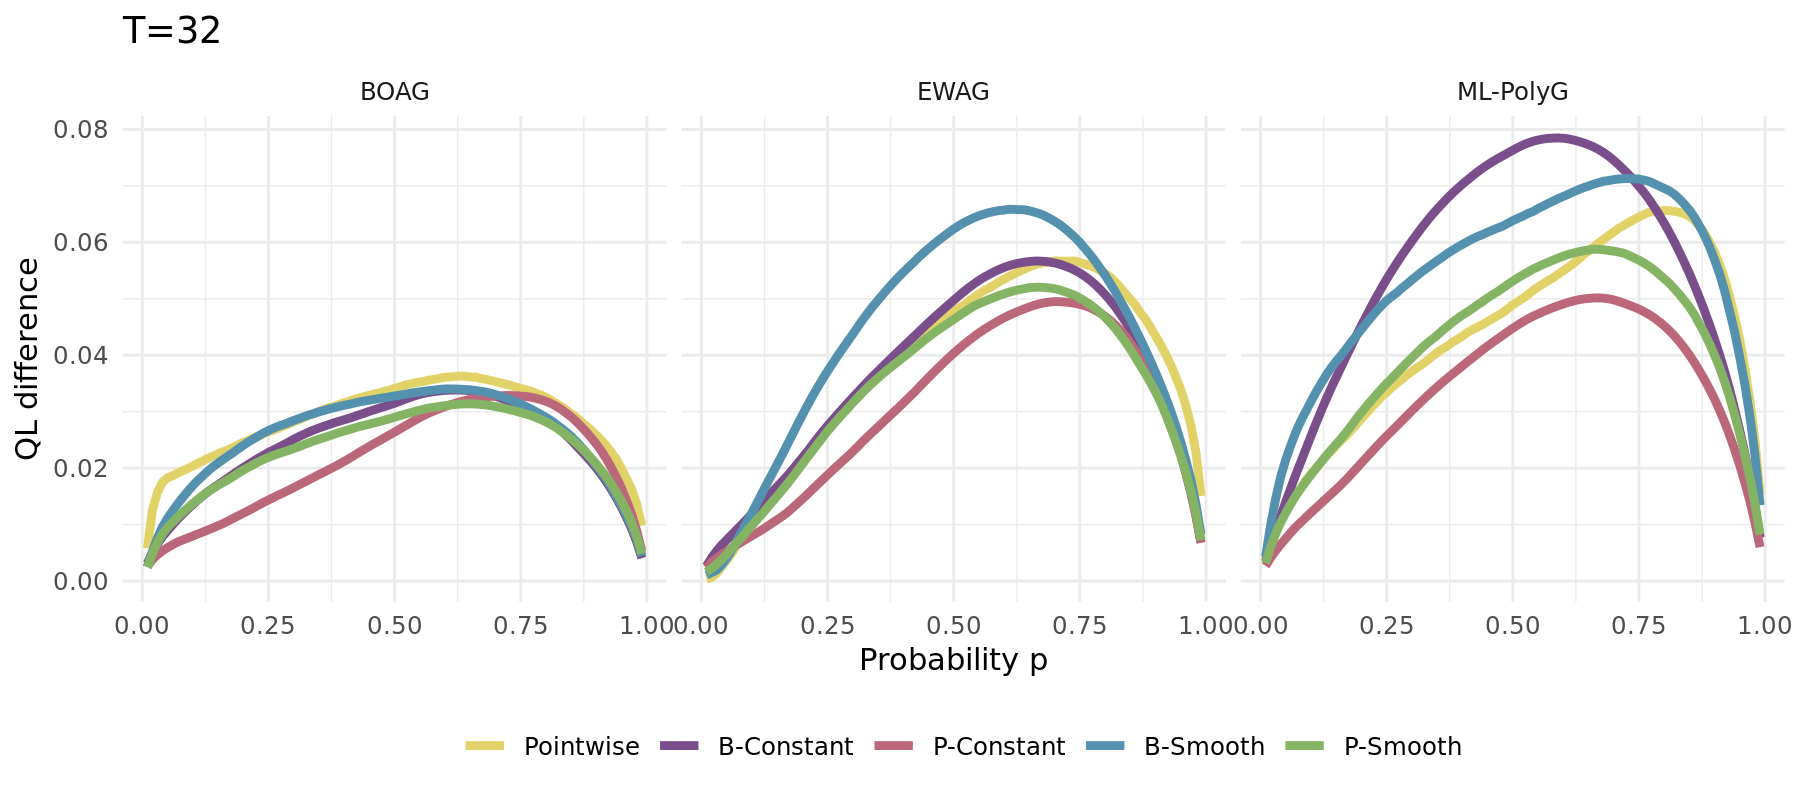
## Application Study: Overview
:::: {.columns}
::: {.column width="29%"}
Data:
- Forecasting European emission allowances (EUA)
- Daily month-ahead prices
- Jan 13 - Dec 20 (Phase III, 2092 Obs)
Combination methods:
- Naive, BOAG, EWAG, ML-PolyG, BMA
Tuning paramter grids:
- Smoothing Penalty: $\Lambda= \{0\}\cup \{2^x|x\in \{-4,-3.5,\ldots,12\}\}$
- Learning Rates: $\mathcal{E}= \{2^x|x\in \{-1,-0.5,\ldots,9\}\}$
:::
::: {.column width="2%"}
:::
::: {.column width="69%"}
```{r, echo = FALSE, fig.width=7, fig.height=5, fig.align='center', cache = TRUE}
load("assets/crps_learning/overview_data.rds")
data %>%
ggplot(aes(x = Date, y = value)) +
geom_line(size = 1, col = col_blue) +
theme_minimal() +
ylab("Value") +
facet_wrap(. ~ name, scales = "free", ncol = 1) +
theme(
text = element_text(size = 15),
strip.background = element_blank(),
strip.text.x = element_blank()
) -> p1
data %>%
ggplot(aes(x = value)) +
geom_histogram(aes(y = ..density..), size = 1, fill = col_blue, bins = 50) +
ylab("Density") +
xlab("Value") +
theme_minimal() +
theme(
strip.background = element_rect(fill = col_lightgray, colour = col_lightgray),
text = element_text(size = 15)
) +
facet_wrap(. ~ name, scales = "free", ncol = 1, strip.position = "right") -> p2
overview <- cowplot::plot_grid(plotlist = list(p1, p2), align = "hv", axis = "tblr", rel_widths = c(0.65, 0.35))
overview
```
:::
::::
## Application Study: Experts
Simple exponential smoothing with additive errors (**ETS-ANN**):
\begin{align*}
Y_{t} = l_{t-1} + \varepsilon_t \quad \text{with} \quad l_t = l_{t-1} + \alpha \varepsilon_t \quad \text{and} \quad \varepsilon_t \sim \mathcal{N}(0,\sigma^2)
\end{align*}
Quantile regression (**QuantReg**): For each $p \in \mathcal{P}$ we assume:
\begin{align*}
F^{-1}_{Y_t}(p) = \beta_{p,0} + \beta_{p,1} Y_{t-1} + \beta_{p,2} |Y_{t-1}-Y_{t-2}|
\end{align*}
ARIMA(1,0,1)-GARCH(1,1) with Gaussian errors (**ARMA-GARCH**):
\begin{align*}
Y_{t} = \mu + \phi(Y_{t-1}-\mu) + \theta \varepsilon_{t-1} + \varepsilon_t \quad \text{with} \quad \varepsilon_t = \sigma_t Z, \quad \sigma_t^2 = \omega + \alpha \varepsilon_{t-1}^2 + \beta \sigma_{t-1}^2 \quad \text{and} \quad Z_t \sim \mathcal{N}(0,1)
\end{align*}
ARIMA(0,1,0)-I-EGARCH(1,1) with Gaussian errors (**I-EGARCH**):
\begin{align*}
Y_{t} = \mu + Y_{t-1} + \varepsilon_t \quad \text{with} \quad \varepsilon_t = \sigma_t Z, \quad \log(\sigma_t^2) = \omega + \alpha Z_{t-1}+ \gamma (|Z_{t-1}|-\mathbb{E}|Z_{t-1}|) + \beta \log(\sigma_{t-1}^2) \quad \text{and} \quad Z_t \sim \mathcal{N}(0,1)
\end{align*}
ARIMA(0,1,0)-GARCH(1,1) with student-t errors (**I-GARCHt**):
\begin{align*}
Y_{t} = \mu + Y_{t-1} + \varepsilon_t \quad \text{with} \quad \varepsilon_t = \sigma_t Z, \quad \sigma_t^2 = \omega + \alpha \varepsilon_{t-1}^2 + \beta \sigma_{t-1}^2 \quad \text{and} \quad Z_t \sim t(0,1, \nu)
\end{align*}
## Results
::: {.panel-tabset}
## Significance
```{r, echo = FALSE, fig.width=7, fig.height=5.5, fig.align='center', cache = TRUE, results='asis'}
load("assets/crps_learning/bernstein_application_study_estimations+learnings_rev1.RData")
quantile_loss <- function(X, y, tau) {
t(t(y - X) * tau) * (y - X > 0) + t(t(X - y) * (1 - tau)) * (y - X < 0)
}
QL <- FCSTN * NA
for (k in 1:dim(QL)[1]) {
QL[k, , ] <- quantile_loss(FCSTN[k, , ], as.numeric(yoos), Qgrid)
}
## TABLE AREA
KK <- length(mnames)
TTinit <- 1 ## without first, as all comb. are uniform
RQL <- apply(QL[1:KK, -c(1:TTinit), ], c(1, 3), mean)
dimnames(RQL) <- list(mnames, Qgrid)
RQLm <- apply(RQL, c(1), mean, na.rm = TRUE)
# sort(RQLm - RQLm[K + 1])
##
qq <- apply(QL[1:KK, -c(1:TTinit), ], c(1, 2), mean)
# t.test(qq[K + 1, ] - qq[K + 3, ])
# t.test(qq[K + 1, ] - qq[K + 4, ])
library(xtable)
Pall <- numeric(KK)
for (i in 1:KK) Pall[i] <- t.test(qq[K + 1, ] - qq[i, ], alternative = "greater")$p.val
Mall <- (RQLm - RQLm[K + 1]) * 10000
Mout <- matrix(Mall[-c(1:(K + 3))], 5, 6)
dimnames(Mout) <- list(moname, mtname)
Pallout <- format(round(Pall, 3), nsmall = 3)
Pallout[Pallout == "0.000"] <- "<.001"
Pallout[Pallout == "1.000"] <- ">.999"
MO <- K
IDX <- c(1:K)
OUT <- t(Mall[IDX])
OUT.num <- OUT
class(OUT.num) <- "numeric"
xxx <- OUT.num
xxxx <- OUT
table <- OUT
table_col <- OUT
i.p <- 1
for (i.p in 1:MO) {
xmax <- -min(Mall) * 5 # max(Mall)
xmin <- min(Mall)
cred <- rev(c(1, 1, 1, 1, 1, 1, 1, 1, 1, 1, 1, 1, .8, .5)) # , .5,0,0,0,1,1,1) ## red
cgreen <- rev(c(.5, .5, .55, .6, .65, .7, .75, .8, .85, .9, .95, 1, 1, .9)) # , .5,0,1,1,1,0,0) ## green
cblue <- rev(c(.55, .5, .5, .5, .5, .5, .5, .5, .5, .5, .5, .5, .5, .5)) # , .5,1,1,0,0,0,1) ## blue
crange <- c(xmin, xmax) ## range
## colors in plot:
fred <- round(approxfun(seq(crange[1], crange[2], length = length(cred)), cred)(pmin(xxx[, i.p], xmax)), 3)
fgreen <- round(approxfun(seq(crange[1], crange[2], length = length(cgreen)), cgreen)(pmin(xxx[, i.p], xmax)), 3)
fblue <- round(approxfun(seq(crange[1], crange[2], length = length(cblue)), cblue)(pmin(xxx[, i.p], xmax)), 3)
tmp <- format(round(xxx[, i.p], 3), nsmall = 3)
xxxx[, i.p] <- paste("\\cellcolor[rgb]{", fred, ",", fgreen, ",", fblue, "}", tmp, " {\\footnotesize (", Pallout[IDX[i.p]], ")}", sep = "")
table[, i.p] <- paste0(tmp, " (", Pallout[i.p], ")")
table_col[, i.p] <- rgb(fred, fgreen, fblue, maxColorValue = 1)
} # i.p
table_out <- kbl(table, align = rep("c", ncol(table)), bootstrap_options = c("condensed")) %>%
kable_paper(full_width = TRUE)
for (j in 1:ncol(table)) {
table_out <- table_out %>%
column_spec(j, background = table_col[, j])
}
table_out
```
```{r, echo = FALSE, fig.width=7, fig.height=5.5, fig.align='center', cache = TRUE, results='asis'}
MO <- 6
OUT <- Mout
OUT.num <- OUT
class(OUT.num) <- "numeric"
xxx <- OUT.num
xxxx <- OUT
i.p <- 1
table2 <- OUT
table_col2 <- OUT
for (i.p in 1:MO) {
xmax <- -min(Mall) * 5 # max(Mall)
xmin <- min(Mall)
cred <- rev(c(1, 1, 1, 1, 1, 1, 1, 1, 1, 1, 1, 1, .8, .5)) # , .5,0,0,0,1,1,1) ## red
cgreen <- rev(c(.5, .5, .55, .6, .65, .7, .75, .8, .85, .9, .95, 1, 1, .9)) # , .5,0,1,1,1,0,0) ## green
cblue <- rev(c(.55, .5, .5, .5, .5, .5, .5, .5, .5, .5, .5, .5, .5, .5)) # , .5,1,1,0,0,0,1) ## blue
crange <- c(xmin, xmax) ## range
## colors in plot:
fred <- round(approxfun(seq(crange[1], crange[2], length = length(cred)), cred)(pmin(xxx[, i.p], xmax)), 3)
fgreen <- round(approxfun(seq(crange[1], crange[2], length = length(cgreen)), cgreen)(pmin(xxx[, i.p], xmax)), 3)
fblue <- round(approxfun(seq(crange[1], crange[2], length = length(cblue)), cblue)(pmin(xxx[, i.p], xmax)), 3)
tmp <- format(round(xxx[, i.p], 3), nsmall = 3)
xxxx[, i.p] <- paste("\\cellcolor[rgb]{", fred, ",", fgreen, ",", fblue, "}", tmp, " {\\footnotesize (", Pallout[K + 3 + 5 * (i.p - 1) + 1:5], ")}", sep = "")
table2[, i.p] <- paste0(tmp, " (", Pallout[K + 3 + 5 * (i.p - 1) + 1:5], ")")
table_col2[, i.p] <- rgb(fred, fgreen, fblue, maxColorValue = 1)
} # i.p
table_out2 <- kableExtra::kbl(table2, align = rep("c", ncol(table2)), bootstrap_options = c("condensed")) %>%
kable_paper(full_width = TRUE)
for (j in 1:ncol(table2)) {
table_out2 <- table_out2 %>%
column_spec(1 + j,
background = table_col2[, j]
)
}
table_out2 %>%
column_spec(1, bold = T)
```
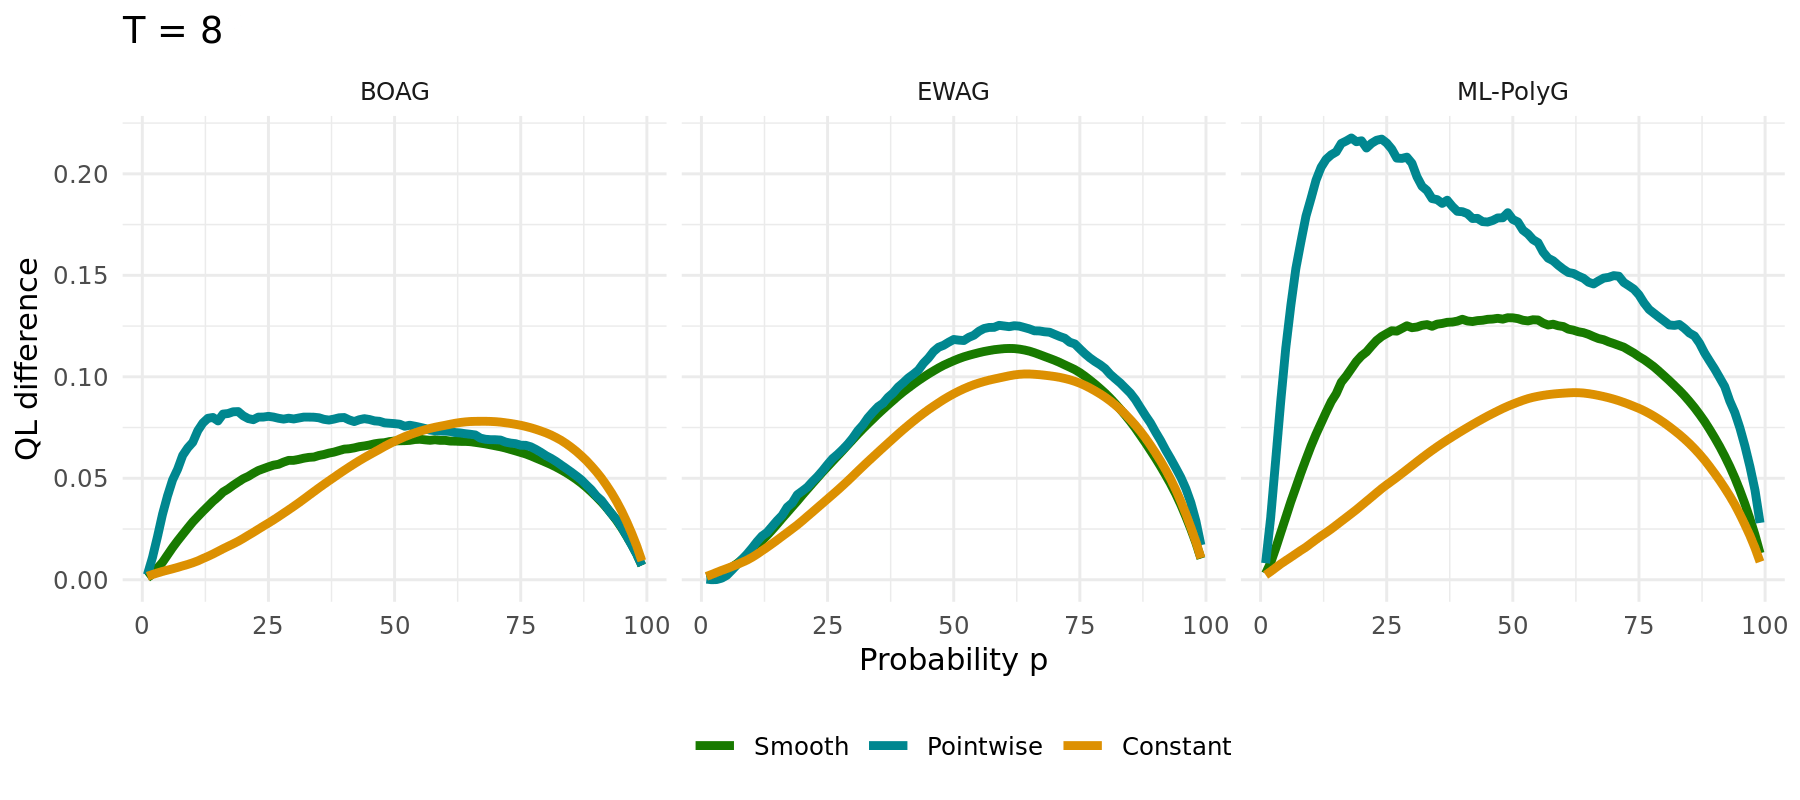
## QL
```{r, echo = FALSE, fig.width=13, fig.height=5.5, fig.align='center', cache = TRUE}
##### Performance across probabilities
M <- length(mnames)
Msel <- c(1:K, K + 1, K + 1 + 2 + 1:4 * 5 - 2) ## experts + naive + smooth
modnames <- mnames[Msel]
tCOL <- c(
"#E6CC00", "#CC6600", "#E61A1A", "#99004D", "#F233BF",
"#666666", "#0000CC", "#1A80E6", "#1AE680", "#00CC00"
)
t(RQL) %>%
as_tibble() %>%
select(Naive) %>%
mutate(Naive = 0) %>%
mutate(p = 1:99 / 100) %>%
pivot_longer(-p, values_to = "Loss differences") -> dummy
t(RQL) %>%
as_tibble() %>%
select(mnames[Msel]) %>%
mutate(p = 1:99 / 100) %>%
pivot_longer(!p & !Naive) %>%
mutate(`Loss differences` = value - Naive) %>%
select(-value, -Naive) %>%
rbind(dummy) %>%
mutate(
p = as.numeric(p),
name = stringr::str_replace(name, "-P-smooth", ""),
name = factor(name, levels = stringr::str_replace(mnames[Msel], "-P-smooth", ""), ordered = T),
`Loss differences` = `Loss differences` * 1000
) %>%
ggplot(aes(x = p, y = `Loss differences`, colour = name)) +
geom_line(linewidth = 1) +
theme_minimal() +
theme(
text = element_text(size = text_size),
legend.position = "bottom"
) +
xlab("Probability p") +
scale_color_manual(NULL, values = tCOL) +
guides(colour = guide_legend(nrow = 2, byrow = TRUE))
```
## Cumulative Loss Difference
```{r, echo = FALSE, fig.width=13, fig.height=5.5, fig.align='center', cache = TRUE}
DQL <- t(apply(apply(QL[1:KK, -c(1:TTinit), ], c(1, 2), mean), 1, cumsum))
rownames(DQL) <- mnames
t(DQL) %>%
as_tibble() %>%
select(Naive) %>%
mutate(
`Difference of cumulative loss` = 0,
Date = ytime[-c(1:(TT + TTinit + 1))],
name = "Naive"
) %>%
select(-Naive) -> dummy
data <- t(DQL) %>%
as_tibble() %>%
select(mnames[Msel]) %>%
mutate(Date = ytime[-c(1:(TT + TTinit + 1))]) %>%
pivot_longer(!Date & !Naive) %>%
mutate(`Difference of cumulative loss` = value - Naive) %>%
select(-value, -Naive) %>%
rbind(dummy) %>%
mutate(
name = stringr::str_replace(name, "-P-smooth", ""),
name = factor(name, levels = stringr::str_replace(mnames[Msel], "-P-smooth", ""))
)
data %>%
ggplot(aes(x = Date, y = `Difference of cumulative loss`, colour = name)) +
geom_line(size = 1) +
theme_minimal() +
theme(
text = element_text(size = text_size),
legend.position = "bottom"
) +
scale_color_manual(NULL, values = tCOL) +
guides(colour = guide_legend(nrow = 2, byrow = TRUE))
```
## Weights (BOAG P-Smooth)
```{r, echo = FALSE, fig.width=13, fig.height=5.5, fig.align='center', cache = TRUE}
load("assets/crps_learning/weights_data.RData")
weights_data %>%
ggplot(aes(Date, p, fill = w)) +
geom_raster(interpolate = TRUE) +
facet_grid(Mod ~ .) +
theme_minimal() +
theme(
plot.margin = unit(c(0.2, 0.2, 0.2, 0.2), "cm"),
text = element_text(size = text_size),
legend.key.height = unit(0.9, "inch")
) +
ylab("p") +
scale_fill_gradientn(
limits = c(0, 1),
colours = colseq,
breaks = seq(0, 1, 0.2)
) +
scale_x_date(expand = c(0, 0))
```
## Weights (Last)
```{r, echo = FALSE, fig.width=13, fig.height=5.5, fig.align='center', cache = TRUE}
load("assets/crps_learning/weights_example.RData")
weights %>%
ggplot(aes(x = p, y = weights, col = Model)) +
geom_line(size = 1.5) +
theme_minimal() +
theme(
plot.margin = unit(c(0.2, 0.3, 0.2, 0.2), "cm"),
text = element_text(size = text_size),
legend.position = "bottom",
legend.title = element_blank(),
panel.spacing = unit(1.5, "lines")
) +
scale_color_manual(NULL, values = tCOL[1:K]) +
facet_grid(. ~ K)
```
::::
## Wrap-Up
:::: {.columns}
::: {.column width="48%"}
Potential Downsides:
- Pointwise optimization can induce quantile crossing
- Can be solved by sorting the predictions
Upsides:
- Pointwise learning outperforms the Naive solution significantly
- Online learning is much faster than batch methods
- Smoothing further improves the predictive performance
- Asymptotically not worse than the best convex combination
:::
::: {.column width="2%"}
:::
::: {.column width="48%"}
Important:
- The choice of the learning rate is crucial
- The loss function has to meet certain criteria
The [`r fontawesome::fa("github")` profoc](https://profoc.berrisch.biz/) R Package:
- Implements all algorithms discussed above
- Is written using RcppArmadillo `r fontawesome::fa("arrow-right", fill ="#000000")` its fast
- Accepts vectors for most parameters
- The best parameter combination is chosen online
- Implements
- Forgetting, Fixed Share
- Different loss functions + gradients
:::
::::
# Multivariate Probabilistic CRPS Learning with an Application to Day-Ahead Electricity Prices
---
## Outline
```{r, include=FALSE}
col_lightgray <- "#e7e7e7"
col_blue <- "#000088"
col_smooth_expost <- "#a7008b"
col_smooth <- "#187a00"
col_pointwise <- "#008790"
col_constant <- "#dd9002"
col_optimum <- "#666666"
col_green <- "#61B94C"
col_orange <- "#ffa600"
col_yellow <- "#FCE135"
```
**Multivariate CRPS Learning**
- Introduction
- Smoothing procedures
- Application to multivariate electricity price forecasts
**The `profoc` R package**
- Package overview
- Implementation details
- Illustrative examples
## The Framework of Prediction under Expert Advice
### The sequential framework
:::: {.columns}
::: {.column width="48%"}
Each day, $t = 1, 2, ... T$
- The **forecaster** receives predictions $\widehat{X}_{t,k}$ from $K$ **experts**
- The **forecaster** assings weights $w_{t,k}$ to each **expert**
- The **forecaster** calculates her prediction:
$$\widetilde{X}_{t}=\sum_{k=1}^K w_{t,k}\widehat{X}_{t,k}$$
- The realization for $t$ is observed
:::
::: {.column width="2%"}
:::
::: {.column width="48%"}
- The experts can be institutions, persons, or models
- The forecasts can be point-forecasts (i.e., mean or median) or full predictive distributions
- We do not need any assumptions concerning the underlying data
- `r Citet(my_bib, "cesa2006prediction")`
:::
::::
## The Regret
Weights are updated sequentially according to the past performance of the $K$ experts.
`r fontawesome::fa("arrow-right", fill ="#000000")` A loss function $\ell$ is needed (to compute the **cumulative regret** $R_{t,k}$)
\begin{equation}
R_{t,k} = \widetilde{L}_{t} - \widehat{L}_{t,k} = \sum_{i = 1}^t \ell(\widetilde{X}_{i},Y_i) - \ell(\widehat{X}_{i,k},Y_i)
\label{eq_regret}
\end{equation}
The cumulative regret:
- Indicates the predictive accuracy of expert $k$ until time $t$.
- Measures how much the forecaster *regrets* not having followed the expert's advice
Popular loss functions for point forecasting `r Citet(my_bib, "gneiting2011making")`:
:::: {.columns}
::: {.column width="48%"}
- $\ell_2$-loss $\ell_2(x, y) = | x -y|^2$
- optimal for mean prediction
:::
::: {.column width="2%"}
:::
::: {.column width="48%"}
- $\ell_1$-loss $\ell_1(x, y) = | x -y|$
- optimal for median predictions
:::
::::
---
:::: {.columns}
::: {.column width="48%"}
### Probabilistic Setting
An appropriate loss:
\begin{align*}
\text{CRPS}(F, y) & = \int_{\mathbb{R}} {(F(x) - \mathbb{1}\{ x > y \})}^2 dx
\label{eq_crps}
\end{align*}
It's strictly proper `r Citet(my_bib, "gneiting2007strictly")`.
Using the CRPS, we can calculate time-adaptive weights $w_{t,k}$. However, what if the experts' performance varies in parts of the distribution?
`r fontawesome::fa("lightbulb", fill = col_yellow)` Utilize this relation:
\begin{align*}
\text{CRPS}(F, y) = 2 \int_0^{1} \text{QL}_p(F^{-1}(p), y) \, d p.
\label{eq_crps_qs}
\end{align*}
... to combine quantiles of the probabilistic forecasts individually using the quantile-loss QL.
:::
::: {.column width="2%"}
:::
::: {.column width="48%"}
### Optimal Convergence
`r fontawesome::fa("exclamation", fill = col_orange)` exp-concavity of the loss is required for *selection* and *convex aggregation* properties
`r fontawesome::fa("exclamation", fill = col_orange)` QL is convex, but not exp-concave
`r fontawesome::fa("arrow-right", fill ="#000000")` The Bernstein Online Aggregation (BOA) lets us weaken the exp-concavity condition.
Convergence rates of BOA are:
`r fontawesome::fa("arrow-right", fill ="#000000")` Almost optimal w.r.t *selection* `r Citet(my_bib, "gaillard2018efficient")`.
`r fontawesome::fa("arrow-right", fill ="#000000")` Almost optimal w.r.t *convex aggregation* `r Citet(my_bib, "wintenberger2017optimal")`.
:::
::::
## Multivariate CRPS Learning
:::: {.columns}
::: {.column width="48%"}
Additionally, we extend the **B-Smooth** and **P-Smooth** procedures to the multivariate setting:
- Basis matrices for reducing
- - the probabilistic dimension from $P$ to $\widetilde P$
- - the multivariate dimension from $D$ to $\widetilde D$
- Hat matrices
- - penalized smoothing across P and D dimensions
We utilize the mean Pinball Score over the entire space for hyperparameter optimization (e.g, $\lambda$)
:::
::: {.column width="2%"}
:::
::: {.column width="48%"}
*Basis Smoothing*
Represent weights as linear combinations of bounded basis functions:
\begin{equation}
\underbrace{\boldsymbol w_{t,k}}_{D \text{ x } P} = \sum_{j=1}^{\widetilde D} \sum_{l=1}^{\widetilde P} \beta_{t,j,l,k} \varphi^{\text{mv}}_{j} \varphi^{\text{pr}}_{l} = \underbrace{\boldsymbol \varphi^{\text{mv}}}_{D\text{ x }\widetilde D} \boldsymbol \beta_{t,k} \underbrace{{\boldsymbol\varphi^{\text{pr}}}'}_{\widetilde P \text{ x }P} \nonumber
\end{equation}
A popular choice: B-Splines
$\boldsymbol \beta_{t,k}$ is calculated using a reduced regret matrix:
$\underbrace{\boldsymbol r_{t,k}}_{\widetilde P \times \widetilde D} = \boldsymbol \varphi^{\text{pr}} \underbrace{\left({\boldsymbol{QL}}_{\mathcal{P}}^{\nabla}(\widetilde{\boldsymbol X}_{t},Y_t)- {\boldsymbol{QL}}_{\mathcal{P}}^{\nabla}(\widehat{\boldsymbol X}_{t},Y_t)\right)}_{\text{PxD}}\boldsymbol \varphi^{\text{mv}}$
If $\widetilde P = P$ it holds that $\boldsymbol \varphi^{pr} = \boldsymbol{I}$ (pointwise)
For $\widetilde P = 1$ we receive constant weights
:::
::::
## Multivariate CRPS Learning
:::: {.columns}
::: {.column width="48%"}
**Penalized smoothing:**
Let $\boldsymbol{\psi}^{\text{mv}}=(\psi_1,\ldots, \psi_{D})$ and $\boldsymbol{\psi}^{\text{pr}}=(\psi_1,\ldots, \psi_{P})$ be two sets of bounded basis functions on $(0,1)$:
\begin{equation}
\boldsymbol w_{t,k} = \boldsymbol{\psi}^{\text{mv}} \boldsymbol{b}_{t,k} {\boldsymbol{\psi}^{pr}}'
\end{equation}
with parameter matix $\boldsymbol b_{t,k}$. The latter is estimated to penalize $L_2$-smoothing which minimizes
\begin{align}
& \| \boldsymbol{\beta}_{t,d, k}' \boldsymbol{\varphi}^{\text{pr}} - \boldsymbol b_{t, d, k}' \boldsymbol{\psi}^{\text{pr}} \|^2_2 + \lambda^{\text{pr}} \| \mathcal{D}_{q} (\boldsymbol b_{t, d, k}' \boldsymbol{\psi}^{\text{pr}}) \|^2_2 + \nonumber \\
& \| \boldsymbol{\beta}_{t, p, k}' \boldsymbol{\varphi}^{\text{mv}} - \boldsymbol b_{t, p, k}' \boldsymbol{\psi}^{\text{mv}} \|^2_2 + \lambda^{\text{mv}} \| \mathcal{D}_{q} (\boldsymbol b_{t, p, k}' \boldsymbol{\psi}^{\text{mv}}) \|^2_2 \nonumber
\end{align}
with differential operator $\mathcal{D}_q$ of order $q$
Computation is easy since we have an analytical solution.
:::
::: {.column width="2%"}
:::
::: {.column width="48%"}
```{r, fig.align="center", echo=FALSE, out.width = "1000px", cache = TRUE}
knitr::include_graphics("assets/mcrps_learning/algorithm.svg")
```
:::
::::
## Application
:::: {.columns}
::: {.column width="48%"}
#### Data
- Day-Ahead electricity price forecasts from `r Citet(my_bib, "marcjasz2022distributional")`
- Produced using probabilistic neural networks
- 24-dimensional distributional forecasts
- Distribution assumptions: JSU and Normal
- 8 experts (4 JSU, 4 Normal)
- 27th Dec. 2018 to 31st Dec. 2020 (736 days)
- We extract 99 quantiles (percentiles)
:::
::: {.column width="2%"}
:::
::: {.column width="48%"}
#### Setup
Evaluation: Exclude first 182 observations
Extensions: Penalized smoothing | Forgetting
Tuning strategies:
- Bayesian Fix
- Sophisticated Baesian Search algorithm
- Online
- Dynamic based on past performance
- Bayesian Online
- First Bayesian Fix then Online
Computation Time: ~30 Minutes
:::
::::
## Special Cases
:::: {.columns}
::: {.column width="48%"}
::: {.panel-tabset}
## Constant
```{r, fig.align="center", echo=FALSE, out.width = "400", cache = TRUE}
knitr::include_graphics("assets/mcrps_learning/constant.svg")
```
## Constant PR
```{r, fig.align="center", echo=FALSE, out.width = "400", cache = TRUE}
knitr::include_graphics("assets/mcrps_learning/constant_pr.svg")
```
## Constant MV
```{r, fig.align="center", echo=FALSE, out.width = "400", cache = TRUE}
knitr::include_graphics("assets/mcrps_learning/constant_mv.svg")
```
::::
:::
::: {.column width="2%"}
:::
::: {.column width="48%"}
::: {.panel-tabset}
## Pointwise
```{r, fig.align="center", echo=FALSE, out.width = "400", cache = TRUE}
knitr::include_graphics("assets/mcrps_learning/pointwise.svg")
```
## Smooth
```{r, fig.align="center", echo=FALSE, out.width = "400", cache = TRUE}
knitr::include_graphics("assets/mcrps_learning/smooth_best.svg")
```
::::
:::
::::
## Results
:::: {.columns}
::: {.column width="55%"}
```{r, cache = TRUE}
load("assets/mcrps_learning/naive_table_df.rds")
table_naive <- naive_table_df %>%
as_tibble() %>%
head(1) %>%
mutate_all(round, 4) %>%
mutate_all(sprintf, fmt = "%#.3f") %>%
kbl(
bootstrap_options = "condensed",
escape = FALSE,
format = "html",
booktabs = FALSE,
align = c("c", rep("c", ncol(naive_table_df) - 1))
) %>%
kable_paper(full_width = TRUE) %>%
row_spec(0:1, color = cols[10, "grey"]) %>%
kable_styling(font_size = 16)
for (i in 1:ncol(naive_table_df)) {
table_naive <- table_naive %>%
column_spec(i,
background = ifelse(
is.na(naive_table_df["stat", i, drop = TRUE][-ncol(naive_table_df)]),
cols[5, "grey"],
col_scale2(
naive_table_df["stat", i, drop = TRUE][-ncol(naive_table_df)],
rng_t
)
),
bold = i == which.min(naive_table_df["loss", ])
)
}
table_naive
load("assets/mcrps_learning/performance_data.rds")
i <- 1
j <- 1
for (j in 1:3) {
for (i in seq_len(nrow(performance_loss_tibble))) {
if (loss_and_dm[i, j, "p.val"] < 0.001) {
performance_loss_tibble[i, 2 + j] <- paste0(
performance_loss_tibble[i, 2 + j],
'***'
)
} else if (loss_and_dm[i, j, "p.val"] < 0.01) {
performance_loss_tibble[i, 2 + j] <- paste0(
performance_loss_tibble[i, 2 + j],
'**'
)
} else if (loss_and_dm[i, j, "p.val"] < 0.05) {
performance_loss_tibble[i, 2 + j] <- paste0(
performance_loss_tibble[i, 2 + j],
'*'
)
} else if (loss_and_dm[i, j, "p.val"] < 0.1) {
performance_loss_tibble[i, 2 + j] <- paste0(
performance_loss_tibble[i, 2 + j],
'.'
)
} else {
performance_loss_tibble[i, 2 + j] <- paste0(
performance_loss_tibble[i, 2 + j]
)
}
}
}
table_performance <- performance_loss_tibble %>%
kbl(
padding=-1L,
col.names = c(
'Description',
'Parameter Tuning',
'BOA',
'ML-Poly',
'EWA'
),
bootstrap_options = "condensed",
# Dont replace any string, dataframe has to be valid latex code ...
escape = FALSE,
format = "html",
align = c("l", "l", rep("c", ncol(performance_loss_tibble)-2))
) %>%
kable_paper(full_width = TRUE) %>%
row_spec(0:nrow(performance_loss_tibble), color = cols[10, "grey"])
# %%
for (i in 3:ncol(performance_loss_tibble)) {
bold_cells <- rep(FALSE, times = nrow(performance_loss_tibble))
loss <- loss_and_dm[, i - 2, "loss"]
table_performance <- table_performance %>%
column_spec(i,
background = c(
col_scale2(
loss_and_dm[, i - 2, "stat"],
rng_t
)
),
bold = loss == min(loss),
)
}
table_performance %>%
kable_styling(font_size = 16)
```
```{=html}
:::
::::
## Application Study: Overview
:::: {.columns}
::: {.column width="29%"}
Data:
- Forecasting European emission allowances (EUA)
- Daily month-ahead prices
- Jan 13 - Dec 20 (Phase III, 2092 Obs)
Combination methods:
- Naive, BOAG, EWAG, ML-PolyG, BMA
Tuning paramter grids:
- Smoothing Penalty: $\Lambda= \{0\}\cup \{2^x|x\in \{-4,-3.5,\ldots,12\}\}$
- Learning Rates: $\mathcal{E}= \{2^x|x\in \{-1,-0.5,\ldots,9\}\}$
:::
::: {.column width="2%"}
:::
::: {.column width="69%"}
```{r, echo = FALSE, fig.width=7, fig.height=5, fig.align='center', cache = TRUE}
load("assets/crps_learning/overview_data.rds")
data %>%
ggplot(aes(x = Date, y = value)) +
geom_line(size = 1, col = col_blue) +
theme_minimal() +
ylab("Value") +
facet_wrap(. ~ name, scales = "free", ncol = 1) +
theme(
text = element_text(size = 15),
strip.background = element_blank(),
strip.text.x = element_blank()
) -> p1
data %>%
ggplot(aes(x = value)) +
geom_histogram(aes(y = ..density..), size = 1, fill = col_blue, bins = 50) +
ylab("Density") +
xlab("Value") +
theme_minimal() +
theme(
strip.background = element_rect(fill = col_lightgray, colour = col_lightgray),
text = element_text(size = 15)
) +
facet_wrap(. ~ name, scales = "free", ncol = 1, strip.position = "right") -> p2
overview <- cowplot::plot_grid(plotlist = list(p1, p2), align = "hv", axis = "tblr", rel_widths = c(0.65, 0.35))
overview
```
:::
::::
## Application Study: Experts
Simple exponential smoothing with additive errors (**ETS-ANN**):
\begin{align*}
Y_{t} = l_{t-1} + \varepsilon_t \quad \text{with} \quad l_t = l_{t-1} + \alpha \varepsilon_t \quad \text{and} \quad \varepsilon_t \sim \mathcal{N}(0,\sigma^2)
\end{align*}
Quantile regression (**QuantReg**): For each $p \in \mathcal{P}$ we assume:
\begin{align*}
F^{-1}_{Y_t}(p) = \beta_{p,0} + \beta_{p,1} Y_{t-1} + \beta_{p,2} |Y_{t-1}-Y_{t-2}|
\end{align*}
ARIMA(1,0,1)-GARCH(1,1) with Gaussian errors (**ARMA-GARCH**):
\begin{align*}
Y_{t} = \mu + \phi(Y_{t-1}-\mu) + \theta \varepsilon_{t-1} + \varepsilon_t \quad \text{with} \quad \varepsilon_t = \sigma_t Z, \quad \sigma_t^2 = \omega + \alpha \varepsilon_{t-1}^2 + \beta \sigma_{t-1}^2 \quad \text{and} \quad Z_t \sim \mathcal{N}(0,1)
\end{align*}
ARIMA(0,1,0)-I-EGARCH(1,1) with Gaussian errors (**I-EGARCH**):
\begin{align*}
Y_{t} = \mu + Y_{t-1} + \varepsilon_t \quad \text{with} \quad \varepsilon_t = \sigma_t Z, \quad \log(\sigma_t^2) = \omega + \alpha Z_{t-1}+ \gamma (|Z_{t-1}|-\mathbb{E}|Z_{t-1}|) + \beta \log(\sigma_{t-1}^2) \quad \text{and} \quad Z_t \sim \mathcal{N}(0,1)
\end{align*}
ARIMA(0,1,0)-GARCH(1,1) with student-t errors (**I-GARCHt**):
\begin{align*}
Y_{t} = \mu + Y_{t-1} + \varepsilon_t \quad \text{with} \quad \varepsilon_t = \sigma_t Z, \quad \sigma_t^2 = \omega + \alpha \varepsilon_{t-1}^2 + \beta \sigma_{t-1}^2 \quad \text{and} \quad Z_t \sim t(0,1, \nu)
\end{align*}
## Results
::: {.panel-tabset}
## Significance
```{r, echo = FALSE, fig.width=7, fig.height=5.5, fig.align='center', cache = TRUE, results='asis'}
load("assets/crps_learning/bernstein_application_study_estimations+learnings_rev1.RData")
quantile_loss <- function(X, y, tau) {
t(t(y - X) * tau) * (y - X > 0) + t(t(X - y) * (1 - tau)) * (y - X < 0)
}
QL <- FCSTN * NA
for (k in 1:dim(QL)[1]) {
QL[k, , ] <- quantile_loss(FCSTN[k, , ], as.numeric(yoos), Qgrid)
}
## TABLE AREA
KK <- length(mnames)
TTinit <- 1 ## without first, as all comb. are uniform
RQL <- apply(QL[1:KK, -c(1:TTinit), ], c(1, 3), mean)
dimnames(RQL) <- list(mnames, Qgrid)
RQLm <- apply(RQL, c(1), mean, na.rm = TRUE)
# sort(RQLm - RQLm[K + 1])
##
qq <- apply(QL[1:KK, -c(1:TTinit), ], c(1, 2), mean)
# t.test(qq[K + 1, ] - qq[K + 3, ])
# t.test(qq[K + 1, ] - qq[K + 4, ])
library(xtable)
Pall <- numeric(KK)
for (i in 1:KK) Pall[i] <- t.test(qq[K + 1, ] - qq[i, ], alternative = "greater")$p.val
Mall <- (RQLm - RQLm[K + 1]) * 10000
Mout <- matrix(Mall[-c(1:(K + 3))], 5, 6)
dimnames(Mout) <- list(moname, mtname)
Pallout <- format(round(Pall, 3), nsmall = 3)
Pallout[Pallout == "0.000"] <- "<.001"
Pallout[Pallout == "1.000"] <- ">.999"
MO <- K
IDX <- c(1:K)
OUT <- t(Mall[IDX])
OUT.num <- OUT
class(OUT.num) <- "numeric"
xxx <- OUT.num
xxxx <- OUT
table <- OUT
table_col <- OUT
i.p <- 1
for (i.p in 1:MO) {
xmax <- -min(Mall) * 5 # max(Mall)
xmin <- min(Mall)
cred <- rev(c(1, 1, 1, 1, 1, 1, 1, 1, 1, 1, 1, 1, .8, .5)) # , .5,0,0,0,1,1,1) ## red
cgreen <- rev(c(.5, .5, .55, .6, .65, .7, .75, .8, .85, .9, .95, 1, 1, .9)) # , .5,0,1,1,1,0,0) ## green
cblue <- rev(c(.55, .5, .5, .5, .5, .5, .5, .5, .5, .5, .5, .5, .5, .5)) # , .5,1,1,0,0,0,1) ## blue
crange <- c(xmin, xmax) ## range
## colors in plot:
fred <- round(approxfun(seq(crange[1], crange[2], length = length(cred)), cred)(pmin(xxx[, i.p], xmax)), 3)
fgreen <- round(approxfun(seq(crange[1], crange[2], length = length(cgreen)), cgreen)(pmin(xxx[, i.p], xmax)), 3)
fblue <- round(approxfun(seq(crange[1], crange[2], length = length(cblue)), cblue)(pmin(xxx[, i.p], xmax)), 3)
tmp <- format(round(xxx[, i.p], 3), nsmall = 3)
xxxx[, i.p] <- paste("\\cellcolor[rgb]{", fred, ",", fgreen, ",", fblue, "}", tmp, " {\\footnotesize (", Pallout[IDX[i.p]], ")}", sep = "")
table[, i.p] <- paste0(tmp, " (", Pallout[i.p], ")")
table_col[, i.p] <- rgb(fred, fgreen, fblue, maxColorValue = 1)
} # i.p
table_out <- kbl(table, align = rep("c", ncol(table)), bootstrap_options = c("condensed")) %>%
kable_paper(full_width = TRUE)
for (j in 1:ncol(table)) {
table_out <- table_out %>%
column_spec(j, background = table_col[, j])
}
table_out
```
```{r, echo = FALSE, fig.width=7, fig.height=5.5, fig.align='center', cache = TRUE, results='asis'}
MO <- 6
OUT <- Mout
OUT.num <- OUT
class(OUT.num) <- "numeric"
xxx <- OUT.num
xxxx <- OUT
i.p <- 1
table2 <- OUT
table_col2 <- OUT
for (i.p in 1:MO) {
xmax <- -min(Mall) * 5 # max(Mall)
xmin <- min(Mall)
cred <- rev(c(1, 1, 1, 1, 1, 1, 1, 1, 1, 1, 1, 1, .8, .5)) # , .5,0,0,0,1,1,1) ## red
cgreen <- rev(c(.5, .5, .55, .6, .65, .7, .75, .8, .85, .9, .95, 1, 1, .9)) # , .5,0,1,1,1,0,0) ## green
cblue <- rev(c(.55, .5, .5, .5, .5, .5, .5, .5, .5, .5, .5, .5, .5, .5)) # , .5,1,1,0,0,0,1) ## blue
crange <- c(xmin, xmax) ## range
## colors in plot:
fred <- round(approxfun(seq(crange[1], crange[2], length = length(cred)), cred)(pmin(xxx[, i.p], xmax)), 3)
fgreen <- round(approxfun(seq(crange[1], crange[2], length = length(cgreen)), cgreen)(pmin(xxx[, i.p], xmax)), 3)
fblue <- round(approxfun(seq(crange[1], crange[2], length = length(cblue)), cblue)(pmin(xxx[, i.p], xmax)), 3)
tmp <- format(round(xxx[, i.p], 3), nsmall = 3)
xxxx[, i.p] <- paste("\\cellcolor[rgb]{", fred, ",", fgreen, ",", fblue, "}", tmp, " {\\footnotesize (", Pallout[K + 3 + 5 * (i.p - 1) + 1:5], ")}", sep = "")
table2[, i.p] <- paste0(tmp, " (", Pallout[K + 3 + 5 * (i.p - 1) + 1:5], ")")
table_col2[, i.p] <- rgb(fred, fgreen, fblue, maxColorValue = 1)
} # i.p
table_out2 <- kableExtra::kbl(table2, align = rep("c", ncol(table2)), bootstrap_options = c("condensed")) %>%
kable_paper(full_width = TRUE)
for (j in 1:ncol(table2)) {
table_out2 <- table_out2 %>%
column_spec(1 + j,
background = table_col2[, j]
)
}
table_out2 %>%
column_spec(1, bold = T)
```
## QL
```{r, echo = FALSE, fig.width=13, fig.height=5.5, fig.align='center', cache = TRUE}
##### Performance across probabilities
M <- length(mnames)
Msel <- c(1:K, K + 1, K + 1 + 2 + 1:4 * 5 - 2) ## experts + naive + smooth
modnames <- mnames[Msel]
tCOL <- c(
"#E6CC00", "#CC6600", "#E61A1A", "#99004D", "#F233BF",
"#666666", "#0000CC", "#1A80E6", "#1AE680", "#00CC00"
)
t(RQL) %>%
as_tibble() %>%
select(Naive) %>%
mutate(Naive = 0) %>%
mutate(p = 1:99 / 100) %>%
pivot_longer(-p, values_to = "Loss differences") -> dummy
t(RQL) %>%
as_tibble() %>%
select(mnames[Msel]) %>%
mutate(p = 1:99 / 100) %>%
pivot_longer(!p & !Naive) %>%
mutate(`Loss differences` = value - Naive) %>%
select(-value, -Naive) %>%
rbind(dummy) %>%
mutate(
p = as.numeric(p),
name = stringr::str_replace(name, "-P-smooth", ""),
name = factor(name, levels = stringr::str_replace(mnames[Msel], "-P-smooth", ""), ordered = T),
`Loss differences` = `Loss differences` * 1000
) %>%
ggplot(aes(x = p, y = `Loss differences`, colour = name)) +
geom_line(linewidth = 1) +
theme_minimal() +
theme(
text = element_text(size = text_size),
legend.position = "bottom"
) +
xlab("Probability p") +
scale_color_manual(NULL, values = tCOL) +
guides(colour = guide_legend(nrow = 2, byrow = TRUE))
```
## Cumulative Loss Difference
```{r, echo = FALSE, fig.width=13, fig.height=5.5, fig.align='center', cache = TRUE}
DQL <- t(apply(apply(QL[1:KK, -c(1:TTinit), ], c(1, 2), mean), 1, cumsum))
rownames(DQL) <- mnames
t(DQL) %>%
as_tibble() %>%
select(Naive) %>%
mutate(
`Difference of cumulative loss` = 0,
Date = ytime[-c(1:(TT + TTinit + 1))],
name = "Naive"
) %>%
select(-Naive) -> dummy
data <- t(DQL) %>%
as_tibble() %>%
select(mnames[Msel]) %>%
mutate(Date = ytime[-c(1:(TT + TTinit + 1))]) %>%
pivot_longer(!Date & !Naive) %>%
mutate(`Difference of cumulative loss` = value - Naive) %>%
select(-value, -Naive) %>%
rbind(dummy) %>%
mutate(
name = stringr::str_replace(name, "-P-smooth", ""),
name = factor(name, levels = stringr::str_replace(mnames[Msel], "-P-smooth", ""))
)
data %>%
ggplot(aes(x = Date, y = `Difference of cumulative loss`, colour = name)) +
geom_line(size = 1) +
theme_minimal() +
theme(
text = element_text(size = text_size),
legend.position = "bottom"
) +
scale_color_manual(NULL, values = tCOL) +
guides(colour = guide_legend(nrow = 2, byrow = TRUE))
```
## Weights (BOAG P-Smooth)
```{r, echo = FALSE, fig.width=13, fig.height=5.5, fig.align='center', cache = TRUE}
load("assets/crps_learning/weights_data.RData")
weights_data %>%
ggplot(aes(Date, p, fill = w)) +
geom_raster(interpolate = TRUE) +
facet_grid(Mod ~ .) +
theme_minimal() +
theme(
plot.margin = unit(c(0.2, 0.2, 0.2, 0.2), "cm"),
text = element_text(size = text_size),
legend.key.height = unit(0.9, "inch")
) +
ylab("p") +
scale_fill_gradientn(
limits = c(0, 1),
colours = colseq,
breaks = seq(0, 1, 0.2)
) +
scale_x_date(expand = c(0, 0))
```
## Weights (Last)
```{r, echo = FALSE, fig.width=13, fig.height=5.5, fig.align='center', cache = TRUE}
load("assets/crps_learning/weights_example.RData")
weights %>%
ggplot(aes(x = p, y = weights, col = Model)) +
geom_line(size = 1.5) +
theme_minimal() +
theme(
plot.margin = unit(c(0.2, 0.3, 0.2, 0.2), "cm"),
text = element_text(size = text_size),
legend.position = "bottom",
legend.title = element_blank(),
panel.spacing = unit(1.5, "lines")
) +
scale_color_manual(NULL, values = tCOL[1:K]) +
facet_grid(. ~ K)
```
::::
## Wrap-Up
:::: {.columns}
::: {.column width="48%"}
Potential Downsides:
- Pointwise optimization can induce quantile crossing
- Can be solved by sorting the predictions
Upsides:
- Pointwise learning outperforms the Naive solution significantly
- Online learning is much faster than batch methods
- Smoothing further improves the predictive performance
- Asymptotically not worse than the best convex combination
:::
::: {.column width="2%"}
:::
::: {.column width="48%"}
Important:
- The choice of the learning rate is crucial
- The loss function has to meet certain criteria
The [`r fontawesome::fa("github")` profoc](https://profoc.berrisch.biz/) R Package:
- Implements all algorithms discussed above
- Is written using RcppArmadillo `r fontawesome::fa("arrow-right", fill ="#000000")` its fast
- Accepts vectors for most parameters
- The best parameter combination is chosen online
- Implements
- Forgetting, Fixed Share
- Different loss functions + gradients
:::
::::
# Multivariate Probabilistic CRPS Learning with an Application to Day-Ahead Electricity Prices
---
## Outline
```{r, include=FALSE}
col_lightgray <- "#e7e7e7"
col_blue <- "#000088"
col_smooth_expost <- "#a7008b"
col_smooth <- "#187a00"
col_pointwise <- "#008790"
col_constant <- "#dd9002"
col_optimum <- "#666666"
col_green <- "#61B94C"
col_orange <- "#ffa600"
col_yellow <- "#FCE135"
```
**Multivariate CRPS Learning**
- Introduction
- Smoothing procedures
- Application to multivariate electricity price forecasts
**The `profoc` R package**
- Package overview
- Implementation details
- Illustrative examples
## The Framework of Prediction under Expert Advice
### The sequential framework
:::: {.columns}
::: {.column width="48%"}
Each day, $t = 1, 2, ... T$
- The **forecaster** receives predictions $\widehat{X}_{t,k}$ from $K$ **experts**
- The **forecaster** assings weights $w_{t,k}$ to each **expert**
- The **forecaster** calculates her prediction:
$$\widetilde{X}_{t}=\sum_{k=1}^K w_{t,k}\widehat{X}_{t,k}$$
- The realization for $t$ is observed
:::
::: {.column width="2%"}
:::
::: {.column width="48%"}
- The experts can be institutions, persons, or models
- The forecasts can be point-forecasts (i.e., mean or median) or full predictive distributions
- We do not need any assumptions concerning the underlying data
- `r Citet(my_bib, "cesa2006prediction")`
:::
::::
## The Regret
Weights are updated sequentially according to the past performance of the $K$ experts.
`r fontawesome::fa("arrow-right", fill ="#000000")` A loss function $\ell$ is needed (to compute the **cumulative regret** $R_{t,k}$)
\begin{equation}
R_{t,k} = \widetilde{L}_{t} - \widehat{L}_{t,k} = \sum_{i = 1}^t \ell(\widetilde{X}_{i},Y_i) - \ell(\widehat{X}_{i,k},Y_i)
\label{eq_regret}
\end{equation}
The cumulative regret:
- Indicates the predictive accuracy of expert $k$ until time $t$.
- Measures how much the forecaster *regrets* not having followed the expert's advice
Popular loss functions for point forecasting `r Citet(my_bib, "gneiting2011making")`:
:::: {.columns}
::: {.column width="48%"}
- $\ell_2$-loss $\ell_2(x, y) = | x -y|^2$
- optimal for mean prediction
:::
::: {.column width="2%"}
:::
::: {.column width="48%"}
- $\ell_1$-loss $\ell_1(x, y) = | x -y|$
- optimal for median predictions
:::
::::
---
:::: {.columns}
::: {.column width="48%"}
### Probabilistic Setting
An appropriate loss:
\begin{align*}
\text{CRPS}(F, y) & = \int_{\mathbb{R}} {(F(x) - \mathbb{1}\{ x > y \})}^2 dx
\label{eq_crps}
\end{align*}
It's strictly proper `r Citet(my_bib, "gneiting2007strictly")`.
Using the CRPS, we can calculate time-adaptive weights $w_{t,k}$. However, what if the experts' performance varies in parts of the distribution?
`r fontawesome::fa("lightbulb", fill = col_yellow)` Utilize this relation:
\begin{align*}
\text{CRPS}(F, y) = 2 \int_0^{1} \text{QL}_p(F^{-1}(p), y) \, d p.
\label{eq_crps_qs}
\end{align*}
... to combine quantiles of the probabilistic forecasts individually using the quantile-loss QL.
:::
::: {.column width="2%"}
:::
::: {.column width="48%"}
### Optimal Convergence
`r fontawesome::fa("exclamation", fill = col_orange)` exp-concavity of the loss is required for *selection* and *convex aggregation* properties
`r fontawesome::fa("exclamation", fill = col_orange)` QL is convex, but not exp-concave
`r fontawesome::fa("arrow-right", fill ="#000000")` The Bernstein Online Aggregation (BOA) lets us weaken the exp-concavity condition.
Convergence rates of BOA are:
`r fontawesome::fa("arrow-right", fill ="#000000")` Almost optimal w.r.t *selection* `r Citet(my_bib, "gaillard2018efficient")`.
`r fontawesome::fa("arrow-right", fill ="#000000")` Almost optimal w.r.t *convex aggregation* `r Citet(my_bib, "wintenberger2017optimal")`.
:::
::::
## Multivariate CRPS Learning
:::: {.columns}
::: {.column width="48%"}
Additionally, we extend the **B-Smooth** and **P-Smooth** procedures to the multivariate setting:
- Basis matrices for reducing
- - the probabilistic dimension from $P$ to $\widetilde P$
- - the multivariate dimension from $D$ to $\widetilde D$
- Hat matrices
- - penalized smoothing across P and D dimensions
We utilize the mean Pinball Score over the entire space for hyperparameter optimization (e.g, $\lambda$)
:::
::: {.column width="2%"}
:::
::: {.column width="48%"}
*Basis Smoothing*
Represent weights as linear combinations of bounded basis functions:
\begin{equation}
\underbrace{\boldsymbol w_{t,k}}_{D \text{ x } P} = \sum_{j=1}^{\widetilde D} \sum_{l=1}^{\widetilde P} \beta_{t,j,l,k} \varphi^{\text{mv}}_{j} \varphi^{\text{pr}}_{l} = \underbrace{\boldsymbol \varphi^{\text{mv}}}_{D\text{ x }\widetilde D} \boldsymbol \beta_{t,k} \underbrace{{\boldsymbol\varphi^{\text{pr}}}'}_{\widetilde P \text{ x }P} \nonumber
\end{equation}
A popular choice: B-Splines
$\boldsymbol \beta_{t,k}$ is calculated using a reduced regret matrix:
$\underbrace{\boldsymbol r_{t,k}}_{\widetilde P \times \widetilde D} = \boldsymbol \varphi^{\text{pr}} \underbrace{\left({\boldsymbol{QL}}_{\mathcal{P}}^{\nabla}(\widetilde{\boldsymbol X}_{t},Y_t)- {\boldsymbol{QL}}_{\mathcal{P}}^{\nabla}(\widehat{\boldsymbol X}_{t},Y_t)\right)}_{\text{PxD}}\boldsymbol \varphi^{\text{mv}}$
If $\widetilde P = P$ it holds that $\boldsymbol \varphi^{pr} = \boldsymbol{I}$ (pointwise)
For $\widetilde P = 1$ we receive constant weights
:::
::::
## Multivariate CRPS Learning
:::: {.columns}
::: {.column width="48%"}
**Penalized smoothing:**
Let $\boldsymbol{\psi}^{\text{mv}}=(\psi_1,\ldots, \psi_{D})$ and $\boldsymbol{\psi}^{\text{pr}}=(\psi_1,\ldots, \psi_{P})$ be two sets of bounded basis functions on $(0,1)$:
\begin{equation}
\boldsymbol w_{t,k} = \boldsymbol{\psi}^{\text{mv}} \boldsymbol{b}_{t,k} {\boldsymbol{\psi}^{pr}}'
\end{equation}
with parameter matix $\boldsymbol b_{t,k}$. The latter is estimated to penalize $L_2$-smoothing which minimizes
\begin{align}
& \| \boldsymbol{\beta}_{t,d, k}' \boldsymbol{\varphi}^{\text{pr}} - \boldsymbol b_{t, d, k}' \boldsymbol{\psi}^{\text{pr}} \|^2_2 + \lambda^{\text{pr}} \| \mathcal{D}_{q} (\boldsymbol b_{t, d, k}' \boldsymbol{\psi}^{\text{pr}}) \|^2_2 + \nonumber \\
& \| \boldsymbol{\beta}_{t, p, k}' \boldsymbol{\varphi}^{\text{mv}} - \boldsymbol b_{t, p, k}' \boldsymbol{\psi}^{\text{mv}} \|^2_2 + \lambda^{\text{mv}} \| \mathcal{D}_{q} (\boldsymbol b_{t, p, k}' \boldsymbol{\psi}^{\text{mv}}) \|^2_2 \nonumber
\end{align}
with differential operator $\mathcal{D}_q$ of order $q$
Computation is easy since we have an analytical solution.
:::
::: {.column width="2%"}
:::
::: {.column width="48%"}
```{r, fig.align="center", echo=FALSE, out.width = "1000px", cache = TRUE}
knitr::include_graphics("assets/mcrps_learning/algorithm.svg")
```
:::
::::
## Application
:::: {.columns}
::: {.column width="48%"}
#### Data
- Day-Ahead electricity price forecasts from `r Citet(my_bib, "marcjasz2022distributional")`
- Produced using probabilistic neural networks
- 24-dimensional distributional forecasts
- Distribution assumptions: JSU and Normal
- 8 experts (4 JSU, 4 Normal)
- 27th Dec. 2018 to 31st Dec. 2020 (736 days)
- We extract 99 quantiles (percentiles)
:::
::: {.column width="2%"}
:::
::: {.column width="48%"}
#### Setup
Evaluation: Exclude first 182 observations
Extensions: Penalized smoothing | Forgetting
Tuning strategies:
- Bayesian Fix
- Sophisticated Baesian Search algorithm
- Online
- Dynamic based on past performance
- Bayesian Online
- First Bayesian Fix then Online
Computation Time: ~30 Minutes
:::
::::
## Special Cases
:::: {.columns}
::: {.column width="48%"}
::: {.panel-tabset}
## Constant
```{r, fig.align="center", echo=FALSE, out.width = "400", cache = TRUE}
knitr::include_graphics("assets/mcrps_learning/constant.svg")
```
## Constant PR
```{r, fig.align="center", echo=FALSE, out.width = "400", cache = TRUE}
knitr::include_graphics("assets/mcrps_learning/constant_pr.svg")
```
## Constant MV
```{r, fig.align="center", echo=FALSE, out.width = "400", cache = TRUE}
knitr::include_graphics("assets/mcrps_learning/constant_mv.svg")
```
::::
:::
::: {.column width="2%"}
:::
::: {.column width="48%"}
::: {.panel-tabset}
## Pointwise
```{r, fig.align="center", echo=FALSE, out.width = "400", cache = TRUE}
knitr::include_graphics("assets/mcrps_learning/pointwise.svg")
```
## Smooth
```{r, fig.align="center", echo=FALSE, out.width = "400", cache = TRUE}
knitr::include_graphics("assets/mcrps_learning/smooth_best.svg")
```
::::
:::
::::
## Results
:::: {.columns}
::: {.column width="55%"}
```{r, cache = TRUE}
load("assets/mcrps_learning/naive_table_df.rds")
table_naive <- naive_table_df %>%
as_tibble() %>%
head(1) %>%
mutate_all(round, 4) %>%
mutate_all(sprintf, fmt = "%#.3f") %>%
kbl(
bootstrap_options = "condensed",
escape = FALSE,
format = "html",
booktabs = FALSE,
align = c("c", rep("c", ncol(naive_table_df) - 1))
) %>%
kable_paper(full_width = TRUE) %>%
row_spec(0:1, color = cols[10, "grey"]) %>%
kable_styling(font_size = 16)
for (i in 1:ncol(naive_table_df)) {
table_naive <- table_naive %>%
column_spec(i,
background = ifelse(
is.na(naive_table_df["stat", i, drop = TRUE][-ncol(naive_table_df)]),
cols[5, "grey"],
col_scale2(
naive_table_df["stat", i, drop = TRUE][-ncol(naive_table_df)],
rng_t
)
),
bold = i == which.min(naive_table_df["loss", ])
)
}
table_naive
load("assets/mcrps_learning/performance_data.rds")
i <- 1
j <- 1
for (j in 1:3) {
for (i in seq_len(nrow(performance_loss_tibble))) {
if (loss_and_dm[i, j, "p.val"] < 0.001) {
performance_loss_tibble[i, 2 + j] <- paste0(
performance_loss_tibble[i, 2 + j],
'***'
)
} else if (loss_and_dm[i, j, "p.val"] < 0.01) {
performance_loss_tibble[i, 2 + j] <- paste0(
performance_loss_tibble[i, 2 + j],
'**'
)
} else if (loss_and_dm[i, j, "p.val"] < 0.05) {
performance_loss_tibble[i, 2 + j] <- paste0(
performance_loss_tibble[i, 2 + j],
'*'
)
} else if (loss_and_dm[i, j, "p.val"] < 0.1) {
performance_loss_tibble[i, 2 + j] <- paste0(
performance_loss_tibble[i, 2 + j],
'.'
)
} else {
performance_loss_tibble[i, 2 + j] <- paste0(
performance_loss_tibble[i, 2 + j]
)
}
}
}
table_performance <- performance_loss_tibble %>%
kbl(
padding=-1L,
col.names = c(
'Description',
'Parameter Tuning',
'BOA',
'ML-Poly',
'EWA'
),
bootstrap_options = "condensed",
# Dont replace any string, dataframe has to be valid latex code ...
escape = FALSE,
format = "html",
align = c("l", "l", rep("c", ncol(performance_loss_tibble)-2))
) %>%
kable_paper(full_width = TRUE) %>%
row_spec(0:nrow(performance_loss_tibble), color = cols[10, "grey"])
# %%
for (i in 3:ncol(performance_loss_tibble)) {
bold_cells <- rep(FALSE, times = nrow(performance_loss_tibble))
loss <- loss_and_dm[, i - 2, "loss"]
table_performance <- table_performance %>%
column_spec(i,
background = c(
col_scale2(
loss_and_dm[, i - 2, "stat"],
rng_t
)
),
bold = loss == min(loss),
)
}
table_performance %>%
kable_styling(font_size = 16)
```
```{=html}
Coloring w.r.t. test statistic:
<-5
-4
-3
-2
-1
0
1
2
3
4
>5
Significance denoted by: . p < 0.1; * p < 0.05; ** p < 0.01; *** p < 0.001;
```
:::
::: {.column width = "45%"}
Foo
:::
::::
## Results
```{r, warning=FALSE, fig.align="center", echo=FALSE, fig.width=12, fig.height=6, cache = TRUE}
load("assets/mcrps_learning/pars_data.rds")
pars_data %>%
ggplot(aes(x = dates, y = value)) +
geom_rect(aes(
ymin = 0,
ymax = value * 1.2,
xmin = dates[1],
xmax = dates[182],
fill = "Burn-In"
)) +
geom_line(aes(color = name), linewidth = linesize, show.legend = FALSE) +
scale_colour_manual(
values = as.character(cols[5, c("pink", "amber", "green")])
) +
facet_grid(name ~ .,
scales = "free_y",
# switch = "both"
) +
scale_y_continuous(
trans = "log2",
labels = scaleFUN
) +
theme_minimal() +
theme(
# plot.margin = unit(c(0.2, 0.2, 0.2, 0.2), "cm"),
text = element_text(size = text_size),
legend.key.width = unit(0.9, "inch"),
legend.position = "none"
) +
ylab(NULL) +
xlab("date") +
scale_fill_manual(NULL,
values = as.character(cols[3, "grey"])
)
```
## Results: Hour 16:00-17:00
```{r, fig.align="center", echo=FALSE, fig.width=12, fig.height=6, cache = TRUE}
load("assets/mcrps_learning/weights_h.rds")
weights_h %>%
ggplot(aes(date, q, fill = weight)) +
geom_raster(interpolate = TRUE) +
facet_grid(
Expert ~ . # , labeller = labeller(Mod = mod_labs)
) +
theme_minimal() +
theme(
# plot.margin = unit(c(0.2, 0.2, 0.2, 0.2), "cm"),
text = element_text(size = text_size),
legend.key.height = unit(0.9, "inch")
) +
scale_x_date(expand = c(0, 0)) +
scale_fill_gradientn(
oob = scales::squish,
limits = c(0, 1),
values = c(seq(0, 0.4, length.out = 8), 0.65, 1),
colours = c(
cols[8, "red"],
cols[5, "deep-orange"],
cols[5, "amber"],
cols[5, "yellow"],
cols[5, "lime"],
cols[5, "light-green"],
cols[5, "green"],
cols[7, "green"],
cols[9, "green"],
cols[10, "green"]
),
breaks = seq(0, 1, 0.1)
) +
xlab("date") +
ylab("probability") +
scale_y_continuous(breaks = c(0.1, 0.5, 0.9))
```
## Results: Median
```{r, fig.align="center", echo=FALSE, fig.width=12, fig.height=6, cache = TRUE}
load("assets/mcrps_learning/weights_q.rds")
weights_q %>%
mutate(hour = as.numeric(hour) - 1) %>%
ggplot(aes(date, hour, fill = weight)) +
geom_raster(interpolate = TRUE) +
facet_grid(
Expert ~ . # , labeller = labeller(Mod = mod_labs)
) +
theme_minimal() +
theme(
# plot.margin = unit(c(0.2, 0.2, 0.2, 0.2), "cm"),
text = element_text(size = text_size),
legend.key.height = unit(0.9, "inch")
) +
scale_x_date(expand = c(0, 0)) +
scale_fill_gradientn(
oob = scales::squish,
limits = c(0, 1),
values = c(seq(0, 0.4, length.out = 8), 0.65, 1),
colours = c(
cols[8, "red"],
cols[5, "deep-orange"],
cols[5, "amber"],
cols[5, "yellow"],
cols[5, "lime"],
cols[5, "light-green"],
cols[5, "green"],
cols[7, "green"],
cols[9, "green"],
cols[10, "green"]
),
breaks = seq(0, 1, 0.1)
) +
xlab("date") +
ylab("hour") +
scale_y_continuous(breaks = c(0, 8, 16, 24))
```
## Profoc R Package
:::: {.columns}
::: {.column width="48%"}
### Probabilistic Forecast Combination - profoc
Available on [Github](https://github.com/BerriJ/profoc) and [CRAN](https://CRAN.R-project.org/package=profoc)
Main Function: `online()` for online learning.
- Works with multivariate and/or probabilistic data
- Implements BOA, ML-POLY, EWA (and the gradient versions)
- Implements many extensions like smoothing, forgetting, thresholding, etc.
- Various loss functions are available
- Various methods (`predict`, `update`, `plot`, etc.)
:::
::: {.column width="2%"}
:::
::: {.column width="48%"}
### Speed
Large parts of profoc are implemented in C++.
 We use `Rcpp`, `RcppArmadillo`, and OpenMP.
We use `Rcpp` modules to expose a class to R
- Offers great flexibility for the end-user
- Requires very little knowledge of C++ code
- High-Level interface is easy to use
:::
::::
## Profoc - B-Spline Basis
::: {.panel-tabset}
## Knot Placement Illustration
```{ojs}
d3 = require("d3@7")
```
```{ojs}
bsplineData = FileAttachment("assets/mcrps_learning/basis_functions.csv").csv({ typed: true })
```
```{ojs}
function updateChartInner(g, x, y, linesGroup, color, line, data) {
// Update axes with transitions
x.domain([0, d3.max(data, d => d.x)]);
g.select(".x-axis").transition().duration(1500).call(d3.axisBottom(x).ticks(10));
y.domain([0, d3.max(data, d => d.y)]);
g.select(".y-axis").transition().duration(1500).call(d3.axisLeft(y).ticks(5));
// Group data by basis function
const dataByFunction = Array.from(d3.group(data, d => d.b));
const keyFn = d => d[0];
// Update basis function lines
const u = linesGroup.selectAll("path").data(dataByFunction, keyFn);
u.join(
enter => enter.append("path").attr("fill","none").attr("stroke-width",3)
.attr("stroke", (_, i) => color(i)).attr("d", d => line(d[1].map(pt => ({x: pt.x, y: 0}))))
.style("opacity",0),
update => update,
exit => exit.transition().duration(1000).style("opacity",0).remove()
)
.transition().duration(1000)
.attr("d", d => line(d[1]))
.attr("stroke", (_, i) => color(i))
.style("opacity",1);
}
chart = {
// State variables for selected parameters
let selectedMu = 0.5;
let selectedSig = 1;
let selectedNonc = 0;
let selectedTailw = 1;
const filteredData = () => bsplineData.filter(d =>
Math.abs(selectedMu - d.mu) < 0.001 &&
d.sig === selectedSig &&
d.nonc === selectedNonc &&
d.tailw === selectedTailw
);
const container = d3.create("div")
.style("max-width", "none")
.style("width", "100%");;
const controlsContainer = container.append("div")
.style("display", "flex")
.style("gap", "20px");
// slider controls
const sliders = [
{ label: 'Mu', get: () => selectedMu, set: v => selectedMu = v, min: 0.1, max: 0.9, step: 0.2 },
{ label: 'Sigma', get: () => Math.log2(selectedSig), set: v => selectedSig = 2 ** v, min: -2, max: 2, step: 1 },
{ label: 'Noncentrality', get: () => selectedNonc, set: v => selectedNonc = v, min: -4, max: 4, step: 2 },
{ label: 'Tailweight', get: () => Math.log2(selectedTailw), set: v => selectedTailw = 2 ** v, min: -2, max: 2, step: 1 }
];
// Build slider controls with D3 data join
const sliderCont = controlsContainer.selectAll('div').data(sliders).join('div')
.style('display','flex').style('align-items','center').style('gap','10px')
.style('flex','1').style('min-width','0px');
sliderCont.append('label').text(d => d.label + ':').style('font-size','20px');
sliderCont.append('input')
.attr('type','range').attr('min', d => d.min).attr('max', d => d.max).attr('step', d => d.step)
.property('value', d => d.get())
.on('input', function(event, d) {
const val = +this.value; d.set(val);
d3.select(this.parentNode).select('span').text(d.label.match(/Sigma|Tailweight/) ? 2**val : val);
updateChart(filteredData());
})
.style('width', '100%');
sliderCont.append('span').text(d => (d.label.match(/Sigma|Tailweight/) ? d.get() : d.get()))
.style('font-size','20px');
// Add Reset button to clear all sliders to their defaults
controlsContainer.append('button')
.text('Reset')
.style('font-size', '20px')
.style('align-self', 'center')
.style('margin-left', 'auto')
.on('click', () => {
// reset state vars
selectedMu = 0.5;
selectedSig = 1;
selectedNonc = 0;
selectedTailw = 1;
// update input positions
sliderCont.selectAll('input').property('value', d => d.get());
// update displayed labels
sliderCont.selectAll('span')
.text(d => d.label.match(/Sigma|Tailweight/) ? (2**d.get()) : d.get());
// redraw chart
updateChart(filteredData());
});
// Build SVG
const width = 800;
const height = 400;
const margin = {top: 40, right: 20, bottom: 40, left: 40};
const innerWidth = width - margin.left - margin.right;
const innerHeight = height - margin.top - margin.bottom;
// Set controls container width to match SVG plot width
controlsContainer.style("max-width", "none").style("width", "100%");
// Distribute each control evenly and make sliders full-width
controlsContainer.selectAll("div").style("flex", "1").style("min-width", "0px");
controlsContainer.selectAll("input").style("width", "100%").style("box-sizing", "border-box");
// Create scales
const x = d3.scaleLinear()
.domain([0, 1])
.range([0, innerWidth]);
const y = d3.scaleLinear()
.domain([0, 1])
.range([innerHeight, 0]);
// Create a color scale for the basis functions
const color = d3.scaleOrdinal(d3.schemeCategory10);
// Create SVG
const svg = d3.create("svg")
.attr("width", "100%")
.attr("height", "auto")
.attr("viewBox", [0, 0, width, height])
.attr("preserveAspectRatio", "xMidYMid meet")
.attr("style", "max-width: 100%; height: auto;");
// Add chart title
// svg.append("text")
// .attr("class", "chart-title")
// .attr("x", width / 2)
// .attr("y", 20)
// .attr("text-anchor", "middle")
// .attr("font-size", "20px")
// .attr("font-weight", "bold");
// Create the chart group
const g = svg.append("g")
.attr("transform", `translate(${margin.left},${margin.top})`);
// Add axes
const xAxis = g.append("g")
.attr("transform", `translate(0,${innerHeight})`)
.attr("class", "x-axis")
.call(d3.axisBottom(x).ticks(10))
.style("font-size", "20px");
const yAxis = g.append("g")
.attr("class", "y-axis")
.call(d3.axisLeft(y).ticks(5))
.style("font-size", "20px");
// Add axis labels
// g.append("text")
// .attr("x", innerWidth / 2)
// .attr("y", innerHeight + 35)
// .attr("text-anchor", "middle")
// .text("x");
// g.append("text")
// .attr("transform", "rotate(-90)")
// .attr("x", -innerHeight / 2)
// .attr("y", -30)
// .attr("text-anchor", "middle")
// .text("y");
// Add a horizontal line at y = 0
g.append("line")
.attr("x1", 0)
.attr("x2", innerWidth)
.attr("y1", y(0))
.attr("y2", y(0))
.attr("stroke", "#000")
.attr("stroke-opacity", 0.2);
// Add gridlines
g.append("g")
.attr("class", "grid-lines")
.selectAll("line")
.data(y.ticks(5))
.join("line")
.attr("x1", 0)
.attr("x2", innerWidth)
.attr("y1", d => y(d))
.attr("y2", d => y(d))
.attr("stroke", "#ccc")
.attr("stroke-opacity", 0.5);
// Create a line generator
const line = d3.line()
.x(d => x(d.x))
.y(d => y(d.y))
.curve(d3.curveBasis);
// Group to contain the basis function lines
const linesGroup = g.append("g")
.attr("class", "basis-functions");
// Store the current basis functions for transition
let currentBasisFunctions = new Map();
// Function to update the chart with new data
function updateChart(data) {
updateChartInner(g, x, y, linesGroup, color, line, data);
}
// Store the update function
svg.node().update = updateChart;
// Initial render
updateChart(filteredData());
container.node().appendChild(svg.node());
return container.node();
}
```
## Knot Placement Details
:::: {.columns}
::: {.column width="48%"}
Basis specification `b_smooth_pr` is internally passed to `make_basis_mats()`:
```{r, echo = TRUE, eval = FALSE, cache = TRUE}
mod <- online(
y = Y,
experts = experts,
tau = 1:99 / 100,
b_smooth_pr = list(
knots = 9,
mu = 0.3, # NEW
sigma = 1,
nonc = 0,
tailweight = 1,
deg = 3
)
)
```
Knots are distributed using the generalized beta distribution.
TODO: Add actual algorithm to backup slides
:::
::: {.column width="2%"}
:::
::: {.column width="48%"}
:::
::::
::::
## Wrap-Up
:::: {.columns}
::: {.column width="48%"}
The [`r fontawesome::fa("github")` profoc](https://profoc.berrisch.biz/) R Package:
Profoc is a flexible framework for online learning.
- It implements several algorithms
- It implements several loss functions
- It implements several extensions
- Its high- and low-level interfaces offer great flexibility
Profoc is fast.
- The core components are written in C++
- The core components utilize OpenMP for parallelization
:::
::: {.column width="2%"}
:::
::: {.column width="48%"}
Multivariate Extension:
- Code is available now
- [Pre-Print](https://arxiv.org/abs/2303.10019) is available now
Get these slides:
We use `Rcpp`, `RcppArmadillo`, and OpenMP.
We use `Rcpp` modules to expose a class to R
- Offers great flexibility for the end-user
- Requires very little knowledge of C++ code
- High-Level interface is easy to use
:::
::::
## Profoc - B-Spline Basis
::: {.panel-tabset}
## Knot Placement Illustration
```{ojs}
d3 = require("d3@7")
```
```{ojs}
bsplineData = FileAttachment("assets/mcrps_learning/basis_functions.csv").csv({ typed: true })
```
```{ojs}
function updateChartInner(g, x, y, linesGroup, color, line, data) {
// Update axes with transitions
x.domain([0, d3.max(data, d => d.x)]);
g.select(".x-axis").transition().duration(1500).call(d3.axisBottom(x).ticks(10));
y.domain([0, d3.max(data, d => d.y)]);
g.select(".y-axis").transition().duration(1500).call(d3.axisLeft(y).ticks(5));
// Group data by basis function
const dataByFunction = Array.from(d3.group(data, d => d.b));
const keyFn = d => d[0];
// Update basis function lines
const u = linesGroup.selectAll("path").data(dataByFunction, keyFn);
u.join(
enter => enter.append("path").attr("fill","none").attr("stroke-width",3)
.attr("stroke", (_, i) => color(i)).attr("d", d => line(d[1].map(pt => ({x: pt.x, y: 0}))))
.style("opacity",0),
update => update,
exit => exit.transition().duration(1000).style("opacity",0).remove()
)
.transition().duration(1000)
.attr("d", d => line(d[1]))
.attr("stroke", (_, i) => color(i))
.style("opacity",1);
}
chart = {
// State variables for selected parameters
let selectedMu = 0.5;
let selectedSig = 1;
let selectedNonc = 0;
let selectedTailw = 1;
const filteredData = () => bsplineData.filter(d =>
Math.abs(selectedMu - d.mu) < 0.001 &&
d.sig === selectedSig &&
d.nonc === selectedNonc &&
d.tailw === selectedTailw
);
const container = d3.create("div")
.style("max-width", "none")
.style("width", "100%");;
const controlsContainer = container.append("div")
.style("display", "flex")
.style("gap", "20px");
// slider controls
const sliders = [
{ label: 'Mu', get: () => selectedMu, set: v => selectedMu = v, min: 0.1, max: 0.9, step: 0.2 },
{ label: 'Sigma', get: () => Math.log2(selectedSig), set: v => selectedSig = 2 ** v, min: -2, max: 2, step: 1 },
{ label: 'Noncentrality', get: () => selectedNonc, set: v => selectedNonc = v, min: -4, max: 4, step: 2 },
{ label: 'Tailweight', get: () => Math.log2(selectedTailw), set: v => selectedTailw = 2 ** v, min: -2, max: 2, step: 1 }
];
// Build slider controls with D3 data join
const sliderCont = controlsContainer.selectAll('div').data(sliders).join('div')
.style('display','flex').style('align-items','center').style('gap','10px')
.style('flex','1').style('min-width','0px');
sliderCont.append('label').text(d => d.label + ':').style('font-size','20px');
sliderCont.append('input')
.attr('type','range').attr('min', d => d.min).attr('max', d => d.max).attr('step', d => d.step)
.property('value', d => d.get())
.on('input', function(event, d) {
const val = +this.value; d.set(val);
d3.select(this.parentNode).select('span').text(d.label.match(/Sigma|Tailweight/) ? 2**val : val);
updateChart(filteredData());
})
.style('width', '100%');
sliderCont.append('span').text(d => (d.label.match(/Sigma|Tailweight/) ? d.get() : d.get()))
.style('font-size','20px');
// Add Reset button to clear all sliders to their defaults
controlsContainer.append('button')
.text('Reset')
.style('font-size', '20px')
.style('align-self', 'center')
.style('margin-left', 'auto')
.on('click', () => {
// reset state vars
selectedMu = 0.5;
selectedSig = 1;
selectedNonc = 0;
selectedTailw = 1;
// update input positions
sliderCont.selectAll('input').property('value', d => d.get());
// update displayed labels
sliderCont.selectAll('span')
.text(d => d.label.match(/Sigma|Tailweight/) ? (2**d.get()) : d.get());
// redraw chart
updateChart(filteredData());
});
// Build SVG
const width = 800;
const height = 400;
const margin = {top: 40, right: 20, bottom: 40, left: 40};
const innerWidth = width - margin.left - margin.right;
const innerHeight = height - margin.top - margin.bottom;
// Set controls container width to match SVG plot width
controlsContainer.style("max-width", "none").style("width", "100%");
// Distribute each control evenly and make sliders full-width
controlsContainer.selectAll("div").style("flex", "1").style("min-width", "0px");
controlsContainer.selectAll("input").style("width", "100%").style("box-sizing", "border-box");
// Create scales
const x = d3.scaleLinear()
.domain([0, 1])
.range([0, innerWidth]);
const y = d3.scaleLinear()
.domain([0, 1])
.range([innerHeight, 0]);
// Create a color scale for the basis functions
const color = d3.scaleOrdinal(d3.schemeCategory10);
// Create SVG
const svg = d3.create("svg")
.attr("width", "100%")
.attr("height", "auto")
.attr("viewBox", [0, 0, width, height])
.attr("preserveAspectRatio", "xMidYMid meet")
.attr("style", "max-width: 100%; height: auto;");
// Add chart title
// svg.append("text")
// .attr("class", "chart-title")
// .attr("x", width / 2)
// .attr("y", 20)
// .attr("text-anchor", "middle")
// .attr("font-size", "20px")
// .attr("font-weight", "bold");
// Create the chart group
const g = svg.append("g")
.attr("transform", `translate(${margin.left},${margin.top})`);
// Add axes
const xAxis = g.append("g")
.attr("transform", `translate(0,${innerHeight})`)
.attr("class", "x-axis")
.call(d3.axisBottom(x).ticks(10))
.style("font-size", "20px");
const yAxis = g.append("g")
.attr("class", "y-axis")
.call(d3.axisLeft(y).ticks(5))
.style("font-size", "20px");
// Add axis labels
// g.append("text")
// .attr("x", innerWidth / 2)
// .attr("y", innerHeight + 35)
// .attr("text-anchor", "middle")
// .text("x");
// g.append("text")
// .attr("transform", "rotate(-90)")
// .attr("x", -innerHeight / 2)
// .attr("y", -30)
// .attr("text-anchor", "middle")
// .text("y");
// Add a horizontal line at y = 0
g.append("line")
.attr("x1", 0)
.attr("x2", innerWidth)
.attr("y1", y(0))
.attr("y2", y(0))
.attr("stroke", "#000")
.attr("stroke-opacity", 0.2);
// Add gridlines
g.append("g")
.attr("class", "grid-lines")
.selectAll("line")
.data(y.ticks(5))
.join("line")
.attr("x1", 0)
.attr("x2", innerWidth)
.attr("y1", d => y(d))
.attr("y2", d => y(d))
.attr("stroke", "#ccc")
.attr("stroke-opacity", 0.5);
// Create a line generator
const line = d3.line()
.x(d => x(d.x))
.y(d => y(d.y))
.curve(d3.curveBasis);
// Group to contain the basis function lines
const linesGroup = g.append("g")
.attr("class", "basis-functions");
// Store the current basis functions for transition
let currentBasisFunctions = new Map();
// Function to update the chart with new data
function updateChart(data) {
updateChartInner(g, x, y, linesGroup, color, line, data);
}
// Store the update function
svg.node().update = updateChart;
// Initial render
updateChart(filteredData());
container.node().appendChild(svg.node());
return container.node();
}
```
## Knot Placement Details
:::: {.columns}
::: {.column width="48%"}
Basis specification `b_smooth_pr` is internally passed to `make_basis_mats()`:
```{r, echo = TRUE, eval = FALSE, cache = TRUE}
mod <- online(
y = Y,
experts = experts,
tau = 1:99 / 100,
b_smooth_pr = list(
knots = 9,
mu = 0.3, # NEW
sigma = 1,
nonc = 0,
tailweight = 1,
deg = 3
)
)
```
Knots are distributed using the generalized beta distribution.
TODO: Add actual algorithm to backup slides
:::
::: {.column width="2%"}
:::
::: {.column width="48%"}
:::
::::
::::
## Wrap-Up
:::: {.columns}
::: {.column width="48%"}
The [`r fontawesome::fa("github")` profoc](https://profoc.berrisch.biz/) R Package:
Profoc is a flexible framework for online learning.
- It implements several algorithms
- It implements several loss functions
- It implements several extensions
- Its high- and low-level interfaces offer great flexibility
Profoc is fast.
- The core components are written in C++
- The core components utilize OpenMP for parallelization
:::
::: {.column width="2%"}
:::
::: {.column width="48%"}
Multivariate Extension:
- Code is available now
- [Pre-Print](https://arxiv.org/abs/2303.10019) is available now
Get these slides:
 [https://berrisch.biz/slides/23_06_ecmi/](https://berrisch.biz/slides/23_06_ecmi/)
:::
::::
# Modeling Volatility and Dependence of European Carbon and Energy Prices
TODO: Add Reference
---
## Motivation
:::: {.columns}
::: {.column width="48%"}
- Understanding European Allowances (EUA) dynamics is important
for several fields:
- - Portfolio & Risk Management,
- - Sustainability Planing
- - Political decisions
- - ...
EUA prices are obviously connected to the energy market
How can the dynamics be characterized?
:::
::: {.column width="2%"}
:::
::: {.column width="48%"}
- Several Questions arise:
- - Data (Pre)processing
- - Modeling Approach
- - Evaluation
:::
::::
## Data
- EUA, natural gas, Brent crude oil, coal
- March 15, 2010, until October 14, 2022
- Data was normalized w.r.t. $\text{CO}_2$ emissions
- Emission-adjusted prices reflects one tonne of $\text{CO}_2$
- We adjusted for inflation by Eurostat's HICP, excluding energy
- Log transformation of the data to stabilize the variance
- ADF Test: All series are stationary in first differences
- Johansen’s likelihood ratio trace test suggests two cointegrating relationships (levels)
- Johansen’s likelihood ratio trace test suggests no cointegrating relationships (logs)
## Data
```{r, echo=FALSE, fig.width = 12, fig.height = 6, fig.align="center", cache = TRUE}
readr::read_csv("assets/voldep/2022_10_14_eur_ref_co2_adj_hvpi_ex_nrg.csv") %>%
select(-EUR_USD, -hvpi_x_nrg) %>%
pivot_longer(-Date) %>%
mutate(name = factor(name,
levels = c("EUA", "Oil", "NGas", "Coal")
)) %>%
ggplot(aes(x = Date, y = value, color = name)) +
geom_line(
linewidth = linesize
) + # The ggplot2 call got a little simpler now :)
geom_vline(
# Beginning of the war
xintercept = as.Date("2022-02-24"),
col = as.character(cols[8, "grey"]),
linetype = "dashed"
) +
ylab("Prices EUR") +
xlab("Date") +
scale_color_manual(
values = as.character(c(
cols[8, col_eua],
cols[8, col_oil],
cols[8, col_gas],
cols[8, col_coal]
)),
labels = c(
"EUA",
"Oil",
"NGas",
"Coal"
)
) +
guides(color = guide_legend(override.aes = list(size = 2))) +
theme_minimal() +
theme(
legend.position = "bottom",
# legend.key.size = unit(1.5, "cm"),
legend.title = element_blank(),
text = element_text(
size = text_size
)
) +
scale_x_date(
breaks = as.Date(
paste0(
as.character(seq(2010, 2022, 2)),
"-01-01"
)
),
date_labels = "%Y"
) +
xlab(NULL) +
scale_y_continuous(trans = "log2")
```
## Modeling Approach: Overview
### VECM: Vector Error Correction Model
- Modeling the expectaion
- Captures the long-run cointegrating relationship
- Different cointegrating ranks, including rank zero (no cointegration)
### GARCH: Generalized Autoregressive Conditional Heteroscedasticity
- Captures the variance dynamics
### Copula: Captures the dependence structure
- Captures: conditional cross-sectional dependence structure
- Dependence allowed to vary over time
## Modeling Approach: Overview
:::: {.columns}
::: {.column width="48%"}
- Let $\boldsymbol{X}_t$ be a $K$-dimensional vector at time $t$
- The forecasting target:
- Conditional joint distribution
- $F_{\boldsymbol{X}_t|\mathcal{F}_{t-1}}$
- $\mathcal{F}_{t}$ is the sigma field generated by all information available up to and including time $t$
Sklars theorem: decompose target into
- marginal distributions: $F_{X_{k,t}|\mathcal{F}_{t-1}}$ for $k=1,\ldots, K$, and
- copula function: $C_{\boldsymbol{U}_{t}|\mathcal{F}_{t - 1}}$
:::
::: {.column width="2%"}
:::
::: {.column width="48%"}
Let $\boldsymbol{x}_t= (x_{1,t},\ldots, x_{K,t})^\intercal$ be the realized values
It holds that:
\begin{align}
F_{\boldsymbol{X}_t|\mathcal{F}_{t-1}}(\boldsymbol{x}_t) = C_{\boldsymbol{U}_{t}|\mathcal{F}_{t - 1}}(\boldsymbol{u}_t) \nonumber
\end{align}
with: $\boldsymbol{u}_t =(u_{1,t},\ldots, u_{K,t})^\intercal$, $u_{k,t} = F_{X_{k,t}|\mathcal{F}_{t-1}}(x_{k,t})$
For brewity we drop the conditioning on $\mathcal{F}_{t-1}$.
The model can be specified as follows
\begin{align}
F(\boldsymbol{x}_t) = C \left[\mathbf{F}(\boldsymbol{x}_t; \boldsymbol{\mu}_t, \boldsymbol{ \sigma }_{t}^2, \boldsymbol{\nu}, \boldsymbol{\lambda}); \Xi_t, \Theta\right] \nonumber
\end{align}
$\Xi_{t}$ denotes time-varying dependence parameters
$\Theta$ denotes time-invariant dependence parameters
We take $C$ as the $t$-copula
:::
::::
## Modeling Approach: Mean and Variance
:::: {.columns}
::: {.column width="48%"}
#### Individual marginal distributions:
$$\mathbf{F} = (F_1, \ldots, F_K)^{\intercal}$$
#### Generalized non-central t-distributions
- To account for heavy tails
- Time varying
- expectation: $\boldsymbol{\mu}_t = (\mu_{1,t}, \ldots, \mu_{K,t})^{\intercal}$
- variance: $\boldsymbol{\sigma}_{t}^2 = (\sigma_{1,t}^2, \ldots, \sigma_{K,t}^2)^{\intercal}$
- Time invariant
- degrees of freedom: $\boldsymbol{\nu} = (\nu_1, \ldots, \nu_K)^{\intercal}$
- noncentrality: $\boldsymbol{\lambda} = (\lambda_1, \ldots, \lambda_K)^{\intercal}$
:::
::: {.column width="2%"}
:::
::: {.column width="48%"}
#### VECM Model
\begin{align}
\Delta \boldsymbol{\mu}_t = \Pi \boldsymbol{x}_{t-1} + \Gamma \Delta \boldsymbol{x}_{t-1} \nonumber
\end{align}
where $\Pi = \alpha \beta^{\intercal}$ is the cointegrating matrix of rank $r$, $0 \leq r\leq K$.
#### GARCH model
\begin{align}
\sigma_{i,t}^2 = & \omega_i + \alpha^+_{i} (\epsilon_{i,t-1}^+)^2 + \alpha^-_{i} (\epsilon_{i,t-1}^-)^2 + \beta_i \sigma_{i,t-1}^2 \nonumber
\end{align}
where $\epsilon_{i,t-1}^+ = \max\{\epsilon_{i,t-1}, 0\}$ ...
Separate coefficients for positive and negative innovations to capture leverage effects.
:::
::::
## Modeling Approach: Dependence
:::: {.columns}
::: {.column width="48%"}
#### Time-varying dependence parameters
\begin{align*}
\Xi_{t} = & \Lambda\left(\boldsymbol{\xi}_{t}\right)
\\
\xi_{ij,t} = & \eta_{0,ij} + \eta_{1,ij} \xi_{ij,t-1} + \eta_{2,ij} z_{i,t-1} z_{j,t-1},
\end{align*}
$\xi_{ij,t}$ is a latent process
$z_{i,t}$ denotes the $i$-th standardized residual from time series $i$ at time point $t$
$\Lambda(\cdot)$ is a link function
- ensures that $\Xi_{t}$ is a valid variance covariance matrix
- ensures that $\Xi_{t}$ does not exceed its support space and remains semi-positive definite
:::
::: {.column width="2%"}
:::
::: {.column width="48%"}
#### Maximum Likelihood Estimation
All parameters can be estimated jointly. Using conditional independence:
\begin{align*}
L = f_{X_1} \prod_{i=2}^T f_{X_i|\mathcal{F}_{i-1}},
\end{align*}
with multivariate conditional density:
\begin{align*}
f_{\mathbf{X}_t}(\mathbf{x}_t | \mathcal{F}_{t-1}) = c\left[\mathbf{F}(\mathbf{x}_t;\boldsymbol{\mu}_t, \boldsymbol{\sigma}_{t}^2, \boldsymbol{\nu},
\boldsymbol{\lambda});\Xi_t, \Theta\right] \cdot \\ \prod_{i=1}^K f_{X_{i,t}}(\mathbf{x}_t;\boldsymbol{\mu}_t, \boldsymbol{\sigma}_{t}^2, \boldsymbol{\nu}, \boldsymbol{\lambda})
\end{align*}
The copula density $c$ can be derived analytically.
:::
::::
## Study Design and Evaluation
:::: {.columns}
::: {.column width="48%"}
#### Rolling-window forecasting study
- 3257 observations total
- Window size: 1000 days (~ four years)
- Forecasting 30-steps-ahead
=> 2227 potential starting points
We sample 250 to reduce computational cost
We draw $2^{12}= 2048$ trajectories from the joint predictive distribution
:::
::: {.column width="2%"}
:::
::: {.column width="48%"}
#### Evaluation
Forecasts are evaluated by the energy score (ES)
\begin{align*}
\text{ES}_t(F, \mathbf{x}_t) = \mathbb{E}_{F} \left(||\tilde{\mathbf{X}}_t - \mathbf{x}_t||_2\right) - \frac{1}{2} \mathbb{E}_F \left(||\tilde{\mathbf{X}}_t - \tilde{\mathbf{X}}_t'||_2 \right)
\end{align*}
where $\mathbf{x}_t$ is the observed $K$-dimensional realization and $\tilde{\mathbf{X}}_t$, respectively $\tilde{\mathbf{X}}_t'$ are independent random vectors distributed according to $F$
For univariate cases the Energy Score becomes the Continuous Ranked Probability Score (CRPS)
:::
::::
## Energy Scores
:::: {.columns}
::: {.column width="48%"}
Relative improvement in ES compared to $\text{RW}^{\sigma, \rho}$
Cellcolor: w.r.t test statistic of Diebold-Mariano test (testing wether the model outperformes the benchmark, greener = better).
```{r, echo=FALSE, results='asis', cache = TRUE}
load("assets/voldep/energy_df.Rdata")
table_energy <- energy %>%
kbl(
digits = 2,
col.names = c(
"Model",
"\\(\\text{ES}^{\\text{All}}_{1-30}\\)",
"\\(\\text{ES}^{\\text{EUA}}_{1-30}\\)",
"\\(\\text{ES}^{\\text{Oil}}_{1-30}\\)",
"\\(\\text{ES}^{\\text{NGas}}_{1-30}\\)",
"\\(\\text{ES}^{\\text{Coal}}_{1-30}\\)",
"\\(\\text{ES}^{\\text{All}}_{1}\\)",
"\\(\\text{ES}^{\\text{All}}_{5}\\)",
"\\(\\text{ES}^{\\text{All}}_{30}\\)"
),
# linesep = "",
bootstrap_options = "condensed",
# Dont replace any string, dataframe has to be valid latex code ...
escape = TRUE,
format = "html",
align = c("l", rep("r", ncol(energy) - 1))
) %>%
kable_paper(full_width = FALSE) %>%
row_spec(0:nrow(energy), color = cols[10, "grey"])
for (i in 2:ncol(energy)) {
bold_cells <- rep(FALSE, times = nrow(energy))
if (all(energy[-1, i, drop = TRUE] < 0)) {
bold_cells[1] <- TRUE
} else {
bold_cells[which.max(energy[-1, i, drop = TRUE]) + 1] <- TRUE
}
table_energy <- table_energy %>%
column_spec(i,
background = c(
cols[5, "grey"],
col_scale2(
energy_dm[, i, drop = TRUE][-1],
rng_t
)
),
bold = bold_cells
)
}
table_energy %>%
kable_styling(
bootstrap_options = c("condensed"),
full_width = TRUE,
font_size = 14
)
```
:::
::: {.column width="2%"}
:::
::: {.column width="48%"}
- Benchmarks:
- $\text{RW}^{\sigma, \rho}$: Random walk with constant volatility and correlation
- Univariate $\text{ETS}^{\sigma}$ with constant volatility
- Vector ETS $VES^{\sigma}$ with constant volatility
- Heteroscedasticity is a main driver of ES
- The VECM model without cointegration (essentially a VAR) is the best performing model in terms of ES overall
- For EUA, the ETS Benchmark is the best performing model in terms of ES
:::
::::
## CRPS Scores
:::: {.columns}
::: {.column width="28%"}
- CRPS solely evaluates the marginal distributions
- The cross-sectional dependence is ignored
- VES models deliver poor performance in short horizons
- For Oil prices the RW Benchmark can't be oupterformed 30 steps ahead
- Both VECM models generally deliver good performance
:::
::: {.column width="2%"}
:::
::: {.column width="68%"}
Improvement in CRPS of selected models relative to $\textrm{RW}^{\sigma, \rho}_{}$ in % (higher = better). Colored according to the test statistic of a DM-Test comparing to $\textrm{RW}^{\sigma, \rho}_{}$ (greener means lower test statistic i.e., better performance compared to $\textrm{RW}^{\sigma, \rho}_{}$).
```{r, echo=FALSE, results = 'asis', cache = TRUE}
load("assets/voldep/crps_df.Rdata")
table_crps <- crps %>%
kbl(
col.names = c("Model", rep(paste0("H", h_sub), 4)),
digits = 1,
linesep = "",
# Dont replace any string, dataframe has to be valid latex code ...
escape = FALSE,
format = "html",
booktabs = TRUE,
align = c("l", rep("r", ncol(crps) - 1))
) %>%
kable_paper(full_width = FALSE)
for (i in 2:ncol(crps)) {
bold_cells <- rep(FALSE, times = nrow(crps))
if (all(crps[-1, i, drop = TRUE] < 0)) {
bold_cells[1] <- TRUE
} else {
bold_cells[which.max(crps[-1, i, drop = TRUE]) + 1] <- TRUE
}
table_crps <- table_crps %>%
column_spec(i,
background = c(cols[5, "grey"], col_scale2(
crps_dm[, i, drop = TRUE][-1], rng_t
)),
bold = bold_cells
)
}
table_crps <- table_crps %>%
add_header_above(c(" ", "EUA" = 3, "Oil" = 3, "NGas" = 3, "Coal" = 3))
table_crps %>%
kable_styling(
bootstrap_options = c("condensed"),
full_width = FALSE,
font_size = 16
)
```
:::
::::
## RMSE
:::: {.columns}
::: {.column width="28%"}
RMSE measures the performance of the forecasts at their mean
- Some models beat the benchmarks at short horizons
Conclusion: the Improvements seen before must be attributed to other parts of the multivariate probabilistic predictive distribution
:::
::: {.column width="2%"}
:::
::: {.column width="68%"}
Improvement in RMSE score of selected models relative to $\textrm{RW}^{\sigma, \rho}_{}$ in % (higher = better). Colored according to the test statistic of a DM-Test comparing to $\textrm{RW}^{\sigma, \rho}_{}$ (greener means lower test statistic i.e., better performance compared to $\textrm{RW}^{\sigma, \rho}_{}$).
```{r, echo=FALSE, results = 'asis', cache = TRUE}
load("assets/voldep/rmsq_df.Rdata")
table_rmsq <- rmsq %>%
kbl(
col.names = c("Model", rep(paste0("H", h_sub), 4)),
digits = 1,
# Dont replace any string, dataframe has to be valid latex code ...
escape = FALSE,
linesep = "",
format = "html",
align = c("l", rep("r", ncol(rmsq) - 1))
) %>%
kable_paper(full_width = FALSE)
for (i in 2:ncol(rmsq)) {
bold_cells <- rep(FALSE, times = nrow(rmsq))
if (all(rmsq[-1, i, drop = TRUE] < 0)) {
bold_cells[1] <- TRUE
} else {
bold_cells[which.max(rmsq[-1, i, drop = TRUE]) + 1] <- TRUE
}
table_rmsq <- table_rmsq %>%
column_spec(i,
background = c(cols[5, "grey"], col_scale2(
rmsq_dm[, i, drop = TRUE][-1], rng_t
)),
bold = bold_cells
)
}
table_rmsq <- table_rmsq %>%
add_header_above(c(" ", "EUA" = 3, "Oil" = 3, "NGas" = 3, "Coal" = 3))
table_rmsq %>%
kable_styling(
bootstrap_options = c("condensed"),
full_width = FALSE,
font_size = 14
)
```
:::
::::
## Evolution of Linear Dependence $\Xi$
```{r, echo=FALSE, fig.width = 12, fig.height = 6, fig.align="center", cache = TRUE}
load("assets/voldep/plot_rho_df.Rdata")
ggplot() +
geom_line(
size = linesize,
data = plot_data[plot_data$name == "5Oil-Coal", ],
aes(x = idx, y = value, col = name)
) +
geom_line(
size = linesize,
data = plot_data[plot_data$name == "2EUA-NGas", ],
aes(x = idx, y = value, col = name)
) +
geom_line(
size = linesize,
data = plot_data[plot_data$name == "1EUA-Oil", ],
aes(x = idx, y = value, col = name)
) +
geom_line(
size = linesize,
data = plot_data[plot_data$name == "3EUA-Coal", ],
aes(x = idx, y = value, col = name)
) +
geom_line(
size = linesize,
data = plot_data[plot_data$name == "6NGas-Coal", ],
aes(x = idx, y = value, col = name)
) +
geom_line(
size = linesize,
data = plot_data[plot_data$name == "4Oil-NGas", ],
aes(x = idx, y = value, col = name)
) +
geom_vline(
xintercept = as.Date("2022-02-24"), # Beginning of the war
col = as.character(cols[8, "grey"]),
linetype = "dashed"
) +
geom_vline(
xintercept = as.Date("2022-02-28"), # Central bank of russia was blocked from access to foreign reserves
col = as.character(cols[8, "grey"]),
linetype = "dotted"
) +
scale_colour_manual(
values = as.character(
cols[
6,
c("green", "purple", "blue", "red", "orange", "brown")
]
),
labels = c(
paste0(varnames[comb[, 1] + 1], "-", varnames[comb[, 2] + 1])
)
) +
theme_minimal() +
theme(
zoom.x = element_rect(fill = cols[4, "grey"], colour = NA),
legend.position = "bottom",
text = element_text(size = text_size)
) +
ylab("Correlation") +
scale_x_date(
breaks = date_breaks_fct,
labels = date_labels_fct
) +
xlab(NULL) +
guides(col = guide_legend(
title = NULL,
nrow = 1,
byrow = TRUE,
override.aes = list(size = 2)
)) +
# scale_y_continuous(breaks = seq(-1.5, 1.0, 0.5)) +
ggforce::facet_zoom(
xlim = c(
as.Date("2022-02-02"),
as.Date("2022-04-30")
),
zoom.size = 1.5,
show.area = TRUE
)
```
## Predictive Quantiles (Russian Invasion)
```{r, echo=FALSE, fig.width = 12, fig.height = 6, fig.align="center", cache = TRUE}
load("assets/voldep/plot_quant_df.Rdata")
plot_quant_data %>% ggplot(aes(x = date, y = value)) +
geom_line(size = 1, aes(col = quant)) +
geom_vline(
xintercept = as.Date("2022-02-24"), # Beginning of the war
col = as.character(cols[8, "grey"]),
linetype = "dashed"
) +
geom_vline(
xintercept = as.Date("2022-02-28"), # Central bank of russia was blocked from access to foreign reserves
col = as.character(cols[8, "grey"]),
linetype = "dotted"
) +
scale_colour_manual(
values = as.character(
c(
cols[
5,
c(1, 2, 3, 5, 6, 7, 8, 9, 10, 11, 12, 13, 15)
],
cols[9, 18]
)
)
) +
facet_grid(var ~ ., scales = "free_y") +
theme_minimal() +
theme(
legend.position = "bottom",
text = element_text(size = text_size),
strip.background = element_rect(
fill = cols[1, 18],
colour = cols[1, 18]
)
) +
ylab("EUR") +
scale_x_date(
breaks = (seq(
as.Date("2022-02-15"),
as.Date("2022-03-31"),
by = "4 day"
) + 1)[-12],
date_labels = "%b %d",
limits = c(as.Date("2022-02-15"), as.Date("2022-03-31"))
) +
xlab(NULL) +
guides(col = guide_legend(
title = "Quantiles [\\%]",
nrow = 2,
byrow = TRUE,
override.aes = list(size = 2)
)) +
scale_y_continuous(
trans = "log2",
breaks = y_breaks
)
```
## Conclusion
:::: {.columns}
::: {.column width="48%"}
Accounting for heteroscedasticity or stabilizing the variance via log transformation is crucial for good performance in terms of ES
- Price dynamics emerged way before the russian invaion into ukraine
- Linear dependence between the series reacted only right after the invasion
- Improvements in forecasting performance is mainly attributed to:
- the tails multivariate probabilistic predictive distribution
- the dependence structure between the marginals
:::
::: {.column width="2%"}
:::
::: {.column width="48%"}
[https://berrisch.biz/slides/23_06_ecmi/](https://berrisch.biz/slides/23_06_ecmi/)
:::
::::
# Modeling Volatility and Dependence of European Carbon and Energy Prices
TODO: Add Reference
---
## Motivation
:::: {.columns}
::: {.column width="48%"}
- Understanding European Allowances (EUA) dynamics is important
for several fields:
- - Portfolio & Risk Management,
- - Sustainability Planing
- - Political decisions
- - ...
EUA prices are obviously connected to the energy market
How can the dynamics be characterized?
:::
::: {.column width="2%"}
:::
::: {.column width="48%"}
- Several Questions arise:
- - Data (Pre)processing
- - Modeling Approach
- - Evaluation
:::
::::
## Data
- EUA, natural gas, Brent crude oil, coal
- March 15, 2010, until October 14, 2022
- Data was normalized w.r.t. $\text{CO}_2$ emissions
- Emission-adjusted prices reflects one tonne of $\text{CO}_2$
- We adjusted for inflation by Eurostat's HICP, excluding energy
- Log transformation of the data to stabilize the variance
- ADF Test: All series are stationary in first differences
- Johansen’s likelihood ratio trace test suggests two cointegrating relationships (levels)
- Johansen’s likelihood ratio trace test suggests no cointegrating relationships (logs)
## Data
```{r, echo=FALSE, fig.width = 12, fig.height = 6, fig.align="center", cache = TRUE}
readr::read_csv("assets/voldep/2022_10_14_eur_ref_co2_adj_hvpi_ex_nrg.csv") %>%
select(-EUR_USD, -hvpi_x_nrg) %>%
pivot_longer(-Date) %>%
mutate(name = factor(name,
levels = c("EUA", "Oil", "NGas", "Coal")
)) %>%
ggplot(aes(x = Date, y = value, color = name)) +
geom_line(
linewidth = linesize
) + # The ggplot2 call got a little simpler now :)
geom_vline(
# Beginning of the war
xintercept = as.Date("2022-02-24"),
col = as.character(cols[8, "grey"]),
linetype = "dashed"
) +
ylab("Prices EUR") +
xlab("Date") +
scale_color_manual(
values = as.character(c(
cols[8, col_eua],
cols[8, col_oil],
cols[8, col_gas],
cols[8, col_coal]
)),
labels = c(
"EUA",
"Oil",
"NGas",
"Coal"
)
) +
guides(color = guide_legend(override.aes = list(size = 2))) +
theme_minimal() +
theme(
legend.position = "bottom",
# legend.key.size = unit(1.5, "cm"),
legend.title = element_blank(),
text = element_text(
size = text_size
)
) +
scale_x_date(
breaks = as.Date(
paste0(
as.character(seq(2010, 2022, 2)),
"-01-01"
)
),
date_labels = "%Y"
) +
xlab(NULL) +
scale_y_continuous(trans = "log2")
```
## Modeling Approach: Overview
### VECM: Vector Error Correction Model
- Modeling the expectaion
- Captures the long-run cointegrating relationship
- Different cointegrating ranks, including rank zero (no cointegration)
### GARCH: Generalized Autoregressive Conditional Heteroscedasticity
- Captures the variance dynamics
### Copula: Captures the dependence structure
- Captures: conditional cross-sectional dependence structure
- Dependence allowed to vary over time
## Modeling Approach: Overview
:::: {.columns}
::: {.column width="48%"}
- Let $\boldsymbol{X}_t$ be a $K$-dimensional vector at time $t$
- The forecasting target:
- Conditional joint distribution
- $F_{\boldsymbol{X}_t|\mathcal{F}_{t-1}}$
- $\mathcal{F}_{t}$ is the sigma field generated by all information available up to and including time $t$
Sklars theorem: decompose target into
- marginal distributions: $F_{X_{k,t}|\mathcal{F}_{t-1}}$ for $k=1,\ldots, K$, and
- copula function: $C_{\boldsymbol{U}_{t}|\mathcal{F}_{t - 1}}$
:::
::: {.column width="2%"}
:::
::: {.column width="48%"}
Let $\boldsymbol{x}_t= (x_{1,t},\ldots, x_{K,t})^\intercal$ be the realized values
It holds that:
\begin{align}
F_{\boldsymbol{X}_t|\mathcal{F}_{t-1}}(\boldsymbol{x}_t) = C_{\boldsymbol{U}_{t}|\mathcal{F}_{t - 1}}(\boldsymbol{u}_t) \nonumber
\end{align}
with: $\boldsymbol{u}_t =(u_{1,t},\ldots, u_{K,t})^\intercal$, $u_{k,t} = F_{X_{k,t}|\mathcal{F}_{t-1}}(x_{k,t})$
For brewity we drop the conditioning on $\mathcal{F}_{t-1}$.
The model can be specified as follows
\begin{align}
F(\boldsymbol{x}_t) = C \left[\mathbf{F}(\boldsymbol{x}_t; \boldsymbol{\mu}_t, \boldsymbol{ \sigma }_{t}^2, \boldsymbol{\nu}, \boldsymbol{\lambda}); \Xi_t, \Theta\right] \nonumber
\end{align}
$\Xi_{t}$ denotes time-varying dependence parameters
$\Theta$ denotes time-invariant dependence parameters
We take $C$ as the $t$-copula
:::
::::
## Modeling Approach: Mean and Variance
:::: {.columns}
::: {.column width="48%"}
#### Individual marginal distributions:
$$\mathbf{F} = (F_1, \ldots, F_K)^{\intercal}$$
#### Generalized non-central t-distributions
- To account for heavy tails
- Time varying
- expectation: $\boldsymbol{\mu}_t = (\mu_{1,t}, \ldots, \mu_{K,t})^{\intercal}$
- variance: $\boldsymbol{\sigma}_{t}^2 = (\sigma_{1,t}^2, \ldots, \sigma_{K,t}^2)^{\intercal}$
- Time invariant
- degrees of freedom: $\boldsymbol{\nu} = (\nu_1, \ldots, \nu_K)^{\intercal}$
- noncentrality: $\boldsymbol{\lambda} = (\lambda_1, \ldots, \lambda_K)^{\intercal}$
:::
::: {.column width="2%"}
:::
::: {.column width="48%"}
#### VECM Model
\begin{align}
\Delta \boldsymbol{\mu}_t = \Pi \boldsymbol{x}_{t-1} + \Gamma \Delta \boldsymbol{x}_{t-1} \nonumber
\end{align}
where $\Pi = \alpha \beta^{\intercal}$ is the cointegrating matrix of rank $r$, $0 \leq r\leq K$.
#### GARCH model
\begin{align}
\sigma_{i,t}^2 = & \omega_i + \alpha^+_{i} (\epsilon_{i,t-1}^+)^2 + \alpha^-_{i} (\epsilon_{i,t-1}^-)^2 + \beta_i \sigma_{i,t-1}^2 \nonumber
\end{align}
where $\epsilon_{i,t-1}^+ = \max\{\epsilon_{i,t-1}, 0\}$ ...
Separate coefficients for positive and negative innovations to capture leverage effects.
:::
::::
## Modeling Approach: Dependence
:::: {.columns}
::: {.column width="48%"}
#### Time-varying dependence parameters
\begin{align*}
\Xi_{t} = & \Lambda\left(\boldsymbol{\xi}_{t}\right)
\\
\xi_{ij,t} = & \eta_{0,ij} + \eta_{1,ij} \xi_{ij,t-1} + \eta_{2,ij} z_{i,t-1} z_{j,t-1},
\end{align*}
$\xi_{ij,t}$ is a latent process
$z_{i,t}$ denotes the $i$-th standardized residual from time series $i$ at time point $t$
$\Lambda(\cdot)$ is a link function
- ensures that $\Xi_{t}$ is a valid variance covariance matrix
- ensures that $\Xi_{t}$ does not exceed its support space and remains semi-positive definite
:::
::: {.column width="2%"}
:::
::: {.column width="48%"}
#### Maximum Likelihood Estimation
All parameters can be estimated jointly. Using conditional independence:
\begin{align*}
L = f_{X_1} \prod_{i=2}^T f_{X_i|\mathcal{F}_{i-1}},
\end{align*}
with multivariate conditional density:
\begin{align*}
f_{\mathbf{X}_t}(\mathbf{x}_t | \mathcal{F}_{t-1}) = c\left[\mathbf{F}(\mathbf{x}_t;\boldsymbol{\mu}_t, \boldsymbol{\sigma}_{t}^2, \boldsymbol{\nu},
\boldsymbol{\lambda});\Xi_t, \Theta\right] \cdot \\ \prod_{i=1}^K f_{X_{i,t}}(\mathbf{x}_t;\boldsymbol{\mu}_t, \boldsymbol{\sigma}_{t}^2, \boldsymbol{\nu}, \boldsymbol{\lambda})
\end{align*}
The copula density $c$ can be derived analytically.
:::
::::
## Study Design and Evaluation
:::: {.columns}
::: {.column width="48%"}
#### Rolling-window forecasting study
- 3257 observations total
- Window size: 1000 days (~ four years)
- Forecasting 30-steps-ahead
=> 2227 potential starting points
We sample 250 to reduce computational cost
We draw $2^{12}= 2048$ trajectories from the joint predictive distribution
:::
::: {.column width="2%"}
:::
::: {.column width="48%"}
#### Evaluation
Forecasts are evaluated by the energy score (ES)
\begin{align*}
\text{ES}_t(F, \mathbf{x}_t) = \mathbb{E}_{F} \left(||\tilde{\mathbf{X}}_t - \mathbf{x}_t||_2\right) - \frac{1}{2} \mathbb{E}_F \left(||\tilde{\mathbf{X}}_t - \tilde{\mathbf{X}}_t'||_2 \right)
\end{align*}
where $\mathbf{x}_t$ is the observed $K$-dimensional realization and $\tilde{\mathbf{X}}_t$, respectively $\tilde{\mathbf{X}}_t'$ are independent random vectors distributed according to $F$
For univariate cases the Energy Score becomes the Continuous Ranked Probability Score (CRPS)
:::
::::
## Energy Scores
:::: {.columns}
::: {.column width="48%"}
Relative improvement in ES compared to $\text{RW}^{\sigma, \rho}$
Cellcolor: w.r.t test statistic of Diebold-Mariano test (testing wether the model outperformes the benchmark, greener = better).
```{r, echo=FALSE, results='asis', cache = TRUE}
load("assets/voldep/energy_df.Rdata")
table_energy <- energy %>%
kbl(
digits = 2,
col.names = c(
"Model",
"\\(\\text{ES}^{\\text{All}}_{1-30}\\)",
"\\(\\text{ES}^{\\text{EUA}}_{1-30}\\)",
"\\(\\text{ES}^{\\text{Oil}}_{1-30}\\)",
"\\(\\text{ES}^{\\text{NGas}}_{1-30}\\)",
"\\(\\text{ES}^{\\text{Coal}}_{1-30}\\)",
"\\(\\text{ES}^{\\text{All}}_{1}\\)",
"\\(\\text{ES}^{\\text{All}}_{5}\\)",
"\\(\\text{ES}^{\\text{All}}_{30}\\)"
),
# linesep = "",
bootstrap_options = "condensed",
# Dont replace any string, dataframe has to be valid latex code ...
escape = TRUE,
format = "html",
align = c("l", rep("r", ncol(energy) - 1))
) %>%
kable_paper(full_width = FALSE) %>%
row_spec(0:nrow(energy), color = cols[10, "grey"])
for (i in 2:ncol(energy)) {
bold_cells <- rep(FALSE, times = nrow(energy))
if (all(energy[-1, i, drop = TRUE] < 0)) {
bold_cells[1] <- TRUE
} else {
bold_cells[which.max(energy[-1, i, drop = TRUE]) + 1] <- TRUE
}
table_energy <- table_energy %>%
column_spec(i,
background = c(
cols[5, "grey"],
col_scale2(
energy_dm[, i, drop = TRUE][-1],
rng_t
)
),
bold = bold_cells
)
}
table_energy %>%
kable_styling(
bootstrap_options = c("condensed"),
full_width = TRUE,
font_size = 14
)
```
:::
::: {.column width="2%"}
:::
::: {.column width="48%"}
- Benchmarks:
- $\text{RW}^{\sigma, \rho}$: Random walk with constant volatility and correlation
- Univariate $\text{ETS}^{\sigma}$ with constant volatility
- Vector ETS $VES^{\sigma}$ with constant volatility
- Heteroscedasticity is a main driver of ES
- The VECM model without cointegration (essentially a VAR) is the best performing model in terms of ES overall
- For EUA, the ETS Benchmark is the best performing model in terms of ES
:::
::::
## CRPS Scores
:::: {.columns}
::: {.column width="28%"}
- CRPS solely evaluates the marginal distributions
- The cross-sectional dependence is ignored
- VES models deliver poor performance in short horizons
- For Oil prices the RW Benchmark can't be oupterformed 30 steps ahead
- Both VECM models generally deliver good performance
:::
::: {.column width="2%"}
:::
::: {.column width="68%"}
Improvement in CRPS of selected models relative to $\textrm{RW}^{\sigma, \rho}_{}$ in % (higher = better). Colored according to the test statistic of a DM-Test comparing to $\textrm{RW}^{\sigma, \rho}_{}$ (greener means lower test statistic i.e., better performance compared to $\textrm{RW}^{\sigma, \rho}_{}$).
```{r, echo=FALSE, results = 'asis', cache = TRUE}
load("assets/voldep/crps_df.Rdata")
table_crps <- crps %>%
kbl(
col.names = c("Model", rep(paste0("H", h_sub), 4)),
digits = 1,
linesep = "",
# Dont replace any string, dataframe has to be valid latex code ...
escape = FALSE,
format = "html",
booktabs = TRUE,
align = c("l", rep("r", ncol(crps) - 1))
) %>%
kable_paper(full_width = FALSE)
for (i in 2:ncol(crps)) {
bold_cells <- rep(FALSE, times = nrow(crps))
if (all(crps[-1, i, drop = TRUE] < 0)) {
bold_cells[1] <- TRUE
} else {
bold_cells[which.max(crps[-1, i, drop = TRUE]) + 1] <- TRUE
}
table_crps <- table_crps %>%
column_spec(i,
background = c(cols[5, "grey"], col_scale2(
crps_dm[, i, drop = TRUE][-1], rng_t
)),
bold = bold_cells
)
}
table_crps <- table_crps %>%
add_header_above(c(" ", "EUA" = 3, "Oil" = 3, "NGas" = 3, "Coal" = 3))
table_crps %>%
kable_styling(
bootstrap_options = c("condensed"),
full_width = FALSE,
font_size = 16
)
```
:::
::::
## RMSE
:::: {.columns}
::: {.column width="28%"}
RMSE measures the performance of the forecasts at their mean
- Some models beat the benchmarks at short horizons
Conclusion: the Improvements seen before must be attributed to other parts of the multivariate probabilistic predictive distribution
:::
::: {.column width="2%"}
:::
::: {.column width="68%"}
Improvement in RMSE score of selected models relative to $\textrm{RW}^{\sigma, \rho}_{}$ in % (higher = better). Colored according to the test statistic of a DM-Test comparing to $\textrm{RW}^{\sigma, \rho}_{}$ (greener means lower test statistic i.e., better performance compared to $\textrm{RW}^{\sigma, \rho}_{}$).
```{r, echo=FALSE, results = 'asis', cache = TRUE}
load("assets/voldep/rmsq_df.Rdata")
table_rmsq <- rmsq %>%
kbl(
col.names = c("Model", rep(paste0("H", h_sub), 4)),
digits = 1,
# Dont replace any string, dataframe has to be valid latex code ...
escape = FALSE,
linesep = "",
format = "html",
align = c("l", rep("r", ncol(rmsq) - 1))
) %>%
kable_paper(full_width = FALSE)
for (i in 2:ncol(rmsq)) {
bold_cells <- rep(FALSE, times = nrow(rmsq))
if (all(rmsq[-1, i, drop = TRUE] < 0)) {
bold_cells[1] <- TRUE
} else {
bold_cells[which.max(rmsq[-1, i, drop = TRUE]) + 1] <- TRUE
}
table_rmsq <- table_rmsq %>%
column_spec(i,
background = c(cols[5, "grey"], col_scale2(
rmsq_dm[, i, drop = TRUE][-1], rng_t
)),
bold = bold_cells
)
}
table_rmsq <- table_rmsq %>%
add_header_above(c(" ", "EUA" = 3, "Oil" = 3, "NGas" = 3, "Coal" = 3))
table_rmsq %>%
kable_styling(
bootstrap_options = c("condensed"),
full_width = FALSE,
font_size = 14
)
```
:::
::::
## Evolution of Linear Dependence $\Xi$
```{r, echo=FALSE, fig.width = 12, fig.height = 6, fig.align="center", cache = TRUE}
load("assets/voldep/plot_rho_df.Rdata")
ggplot() +
geom_line(
size = linesize,
data = plot_data[plot_data$name == "5Oil-Coal", ],
aes(x = idx, y = value, col = name)
) +
geom_line(
size = linesize,
data = plot_data[plot_data$name == "2EUA-NGas", ],
aes(x = idx, y = value, col = name)
) +
geom_line(
size = linesize,
data = plot_data[plot_data$name == "1EUA-Oil", ],
aes(x = idx, y = value, col = name)
) +
geom_line(
size = linesize,
data = plot_data[plot_data$name == "3EUA-Coal", ],
aes(x = idx, y = value, col = name)
) +
geom_line(
size = linesize,
data = plot_data[plot_data$name == "6NGas-Coal", ],
aes(x = idx, y = value, col = name)
) +
geom_line(
size = linesize,
data = plot_data[plot_data$name == "4Oil-NGas", ],
aes(x = idx, y = value, col = name)
) +
geom_vline(
xintercept = as.Date("2022-02-24"), # Beginning of the war
col = as.character(cols[8, "grey"]),
linetype = "dashed"
) +
geom_vline(
xintercept = as.Date("2022-02-28"), # Central bank of russia was blocked from access to foreign reserves
col = as.character(cols[8, "grey"]),
linetype = "dotted"
) +
scale_colour_manual(
values = as.character(
cols[
6,
c("green", "purple", "blue", "red", "orange", "brown")
]
),
labels = c(
paste0(varnames[comb[, 1] + 1], "-", varnames[comb[, 2] + 1])
)
) +
theme_minimal() +
theme(
zoom.x = element_rect(fill = cols[4, "grey"], colour = NA),
legend.position = "bottom",
text = element_text(size = text_size)
) +
ylab("Correlation") +
scale_x_date(
breaks = date_breaks_fct,
labels = date_labels_fct
) +
xlab(NULL) +
guides(col = guide_legend(
title = NULL,
nrow = 1,
byrow = TRUE,
override.aes = list(size = 2)
)) +
# scale_y_continuous(breaks = seq(-1.5, 1.0, 0.5)) +
ggforce::facet_zoom(
xlim = c(
as.Date("2022-02-02"),
as.Date("2022-04-30")
),
zoom.size = 1.5,
show.area = TRUE
)
```
## Predictive Quantiles (Russian Invasion)
```{r, echo=FALSE, fig.width = 12, fig.height = 6, fig.align="center", cache = TRUE}
load("assets/voldep/plot_quant_df.Rdata")
plot_quant_data %>% ggplot(aes(x = date, y = value)) +
geom_line(size = 1, aes(col = quant)) +
geom_vline(
xintercept = as.Date("2022-02-24"), # Beginning of the war
col = as.character(cols[8, "grey"]),
linetype = "dashed"
) +
geom_vline(
xintercept = as.Date("2022-02-28"), # Central bank of russia was blocked from access to foreign reserves
col = as.character(cols[8, "grey"]),
linetype = "dotted"
) +
scale_colour_manual(
values = as.character(
c(
cols[
5,
c(1, 2, 3, 5, 6, 7, 8, 9, 10, 11, 12, 13, 15)
],
cols[9, 18]
)
)
) +
facet_grid(var ~ ., scales = "free_y") +
theme_minimal() +
theme(
legend.position = "bottom",
text = element_text(size = text_size),
strip.background = element_rect(
fill = cols[1, 18],
colour = cols[1, 18]
)
) +
ylab("EUR") +
scale_x_date(
breaks = (seq(
as.Date("2022-02-15"),
as.Date("2022-03-31"),
by = "4 day"
) + 1)[-12],
date_labels = "%b %d",
limits = c(as.Date("2022-02-15"), as.Date("2022-03-31"))
) +
xlab(NULL) +
guides(col = guide_legend(
title = "Quantiles [\\%]",
nrow = 2,
byrow = TRUE,
override.aes = list(size = 2)
)) +
scale_y_continuous(
trans = "log2",
breaks = y_breaks
)
```
## Conclusion
:::: {.columns}
::: {.column width="48%"}
Accounting for heteroscedasticity or stabilizing the variance via log transformation is crucial for good performance in terms of ES
- Price dynamics emerged way before the russian invaion into ukraine
- Linear dependence between the series reacted only right after the invasion
- Improvements in forecasting performance is mainly attributed to:
- the tails multivariate probabilistic predictive distribution
- the dependence structure between the marginals
:::
::: {.column width="2%"}
:::
::: {.column width="48%"}
 `r fontawesome::fa("newspaper")` `r Citet(my_bib, "berrisch2023modeling")`
:::
::::
## References
::: {.scrollable}
```{r refs1, echo=FALSE, results="asis"}
PrintBibliography(my_bib, .opts = list(style = "text"))
```
::::
`r fontawesome::fa("newspaper")` `r Citet(my_bib, "berrisch2023modeling")`
:::
::::
## References
::: {.scrollable}
```{r refs1, echo=FALSE, results="asis"}
PrintBibliography(my_bib, .opts = list(style = "text"))
```
::::